|
|
The following information applies to version 2 (and later) of the Utilization application. Do you need to install or update the Utilization app? See Manage Applications for instructions about the App Store. |
Prerequisites
- StorNext 5.4 or later
- Licensed Storage Manager tiers to view archive storage tier statistics. See the StorNext Licenses page of the StorNext 6 Documentation Center for details about StorNext licensing.
Caution: If NTP is not configured, and a system in the environment transmits statistics to StorNext Connect with a time that is later than the time on the StorNext Connect server, the stats are discarded and StorNext Connect does not report accurate monitoring stats.
The Utilization app shows the current statistics in addition to historical and future trends for the environment’s storage tiers, including a detailed view for each system and for each volume (file system) of a system. A system is an MDC or client that provides statistics. In the case of a high availability (HA) Quantum appliance, the primary MDC (Node 1) sends the statistics to the StorNext Connect system (Node 2).


|
|
|
|||||||||
|
|
|
|||||||||
|
|
|
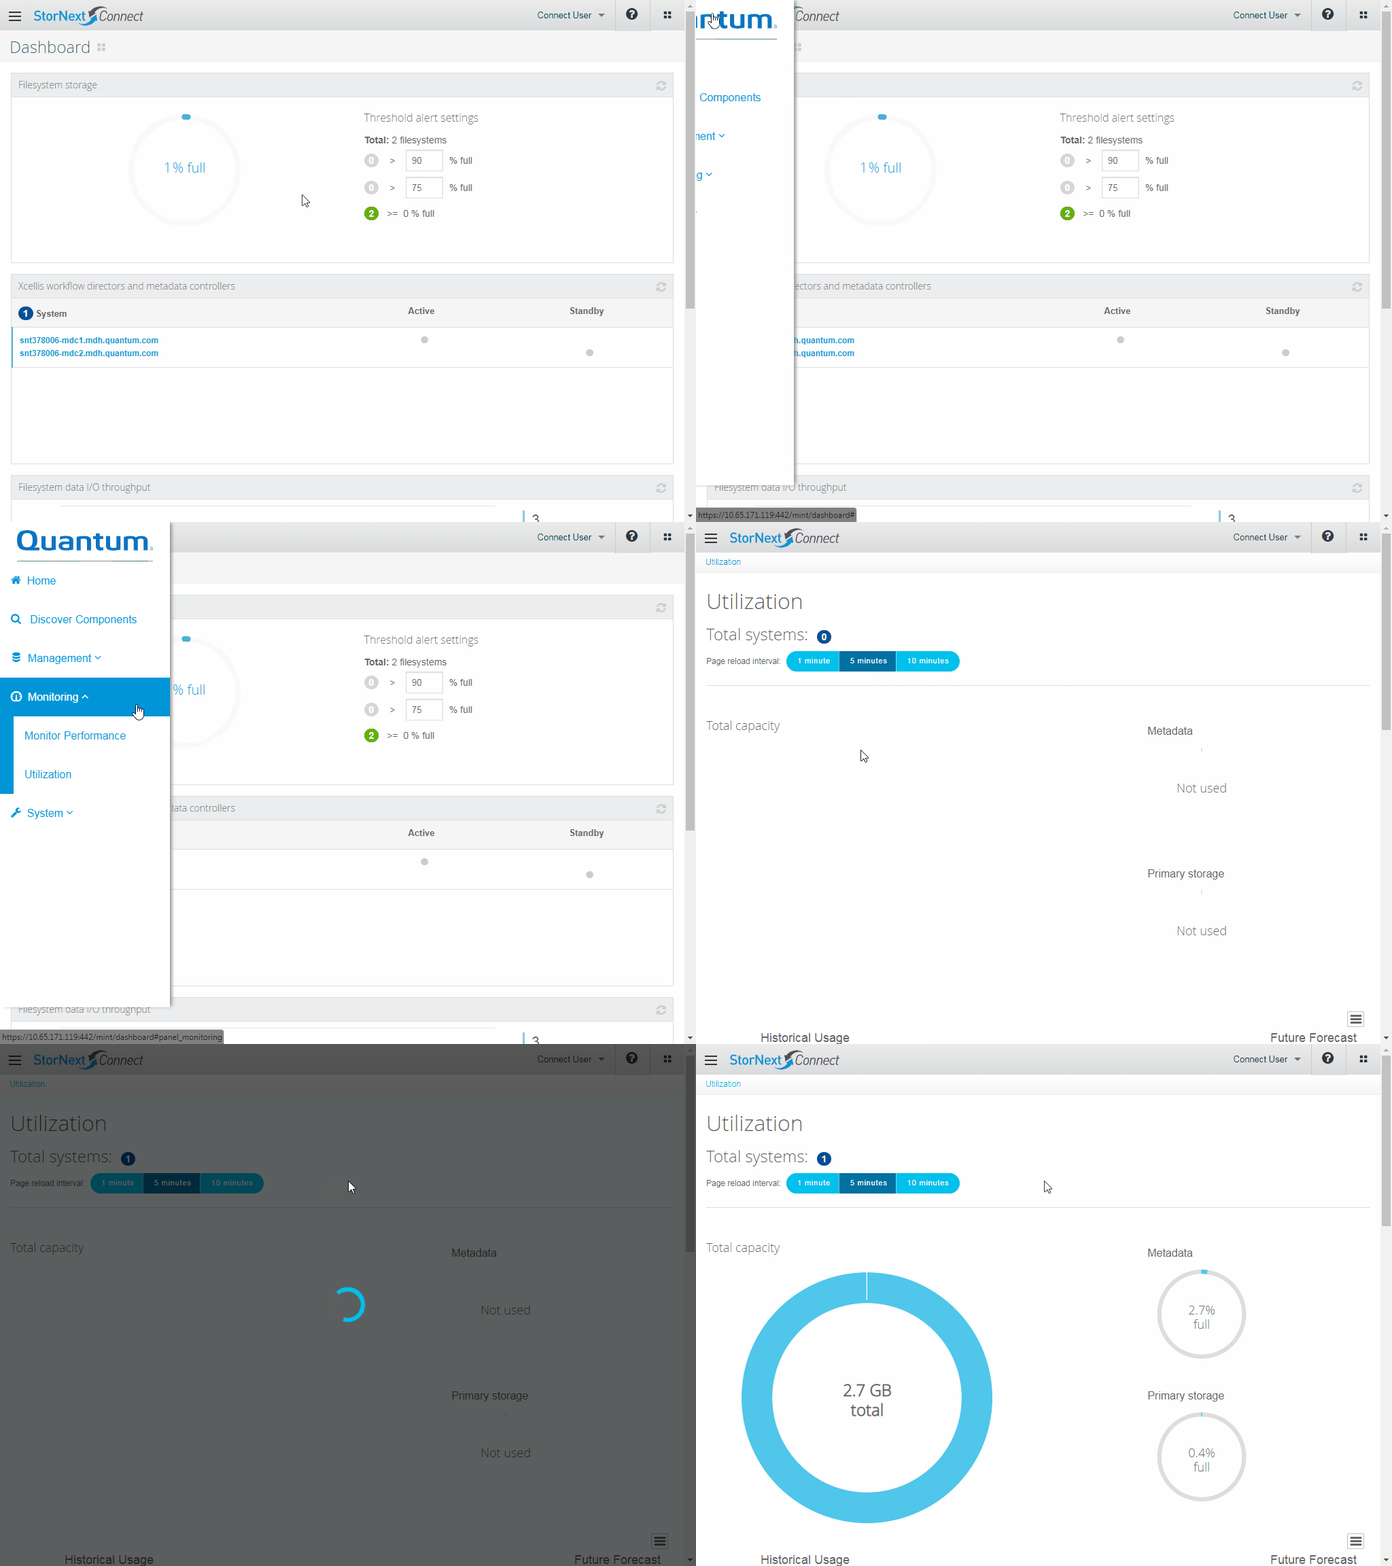
When you open the app, the app shows the utilization data for all systems in the environment. Use the system links in the Capacity/Activity tables to drill into the utilization view for a particular system. Then use the volume (file system) links in the Capacity/Activity tables to drill into the utilization view for a particular volume. To return to a broader view, use the breadcrumb links at the top of the page.
The page reload interval indicates how frequently the data on the page is reloaded (refreshed). The default is 1 minute.
To configure the page reload interval, click one of the time interval buttons:
- 1 minute
- 5 minutes
- 10 minutes
Changes in the following data depend on how often the statistic is updated as well as the type of chart or graph:
| Chart or Graph | Refresh Interval |
|---|---|
|
Historical Usage/Future Forecast capacity chart |
Summarized per day and updated depending on the refresh interval you select. Upon the app refresh, the app resets the chart to the default display (if you changed the zoom). |
|
Activity table |
Summarized on a per day average and updated depending on the refresh interval you select. |
In addition, when the Utilization app page is refreshed, the page resets to the default display. For example, if you scroll down and click the Activity tab to show the read/write activity, the page load will reset the display to the top of the page, and if you scroll down again you'll notice the default Capacity table is shown instead of the Activity table.
Note: Be patient! The page load time of the Utilization app can take longer than other StorNext Connect applications because of the many data points being rendered. Other factors can also affect the page load time, such as the network, CPU speed, and RAM of the browser system.
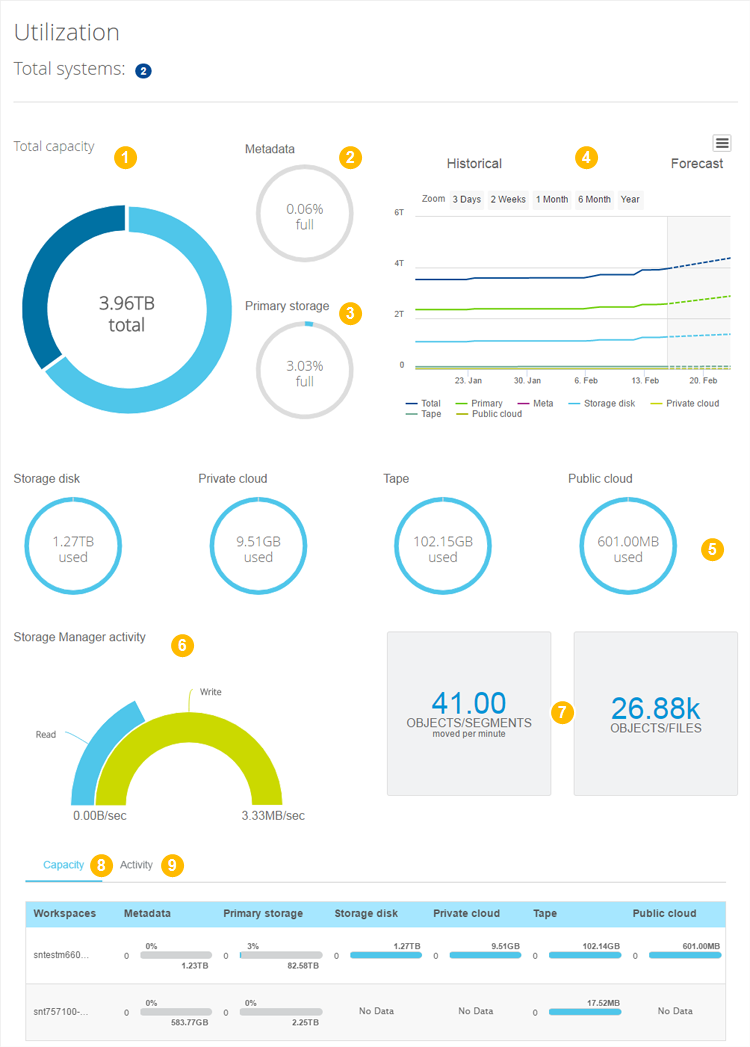
The Total capacity chart is interactive. When you point to a segment of the chart, the percentage of archived or primary storage is shown. When you click a segment of the chart, the chart shows the amount of capacity used for the segment. Click the Total capacity heading to show the amount of capacity used for both primary storage and archive storage.
The HA shared volume (unmanaged) is included in the total capacity. Metadata is not reported in this chart.
The historical usage/future forecast capacity chart can help you understand the capacity of the environment (all systems), an individual system, or an individual volume over time. The Historical Usage section of the chart shows up to one year of data. The Future Forecast section of the chart is a projection of future capacity based on historical capacity, for up to three months of data.
The chart shows space used (in bytes) for all tiers. Clicking the legend name for a tier updates the chart to hide (or show) the data for that tier. The chart total includes metadata, primary storage, and archive tier storage.
By default, the chart shows one month of historical usage data. Use the zoom buttons to show a smaller or larger time frame:
- 3 Days
- 2 Weeks
- 1 Month
- 6 Months
- Year
The Utilization app includes charts showing the amount of capacity used (in bytes) for each Storage Manager (archive storage) tier. If the environment (all systems), an individual system, or an individual volume does not include a particular tier, the app shows Not Used. Not Used also appears if the data for a tier is zero or null. See the Storage Destinations and Storage Policies sections of the StorNext Documentation Center for information about configuring storage tiers and storage policies.
Because StorNext Connect does not receive statistics about the tier limits (amount of capacity available), the archive tier graphs always show a full circle.
| Archive Tier | Description |
|---|---|
|
Storage disk (SDISK) |
Storage disks are external devices on UNIX-based volumes that function and operate the same way as physical tape media; that is, as a tertiary tier of storage. |
|
Private cloud |
Private cloud is the tier representing Lattus Object Storage (S3). |
|
Tape |
Tape is the tier representing the tape library destination(s) (for example, AEL 500). Statistics are not reported on individual tape (media ID) basis, but instead are generalized by tape type. Only LTO tape media statistics are reported. |
|
Public cloud |
Public cloud is the tier representing Amazon Web Service (AWS) storage. |
The Storage Manager activity graph shows the aggregated data movement speeds for all archive storage tiers. It does not include primary storage statistics. The maximum value charted is the highest historical value of either reads or writes, and the graph's read and write arcs adjust relative to the high watermark. Click the read arc or write arc to display the read or write speed, respectively. The data is the last minute's data point for all systems, the specific system, or the specific volume.
Use this graph to evaluate:
- If archives are being created (writes greater than zero).
- If archives are being used (reads greater than zero).
- How current archiving compares to past archiving. Compare the current read/write values to the historical maximum value.
- Whether storage usage could be managed differently (reads greater than writes). Reads exceeding writes could indicate that data is being archived when it is still actively used, and you might consider re-configuring your policies to wait longer before removing files from primary storage. Reads exceeding writes could also indicate an operational anomaly (for example, you have restored a large number of files, or you have migrated a system) or that more primary storage is needed.
When the read activity or write activity is null or zero, the corresponding read arc or write arc flattens to a horizontal line.
The objects or segments moved per minute chart shows the most recent speed of objects or file segments moved by Storage Manager.
The objects or files stored chart shows the total number of objects or file segments under management for all archive storage tiers. The total number includes all copies and versions.
These values, when combined with the working knowledge of your environment and its benchmarks, can help you understand Storage Manager activity and performance.
At the high-level view (all systems), the Capacity table's bar charts show capacity by tier for each system. When you view an individual system, the bar charts show capacity by tier for each volume. The table is not shown when you view an individual volume.
The primary and metadata tier columns show the percentage used. The archive storage tier columns will always show full bars because StorNext Connect does not know the archive storage tier limits. If a system or volume does not include a particular tier, the app shows Not Used. Not Used also appears if the data for a tier is zero or null.
The Activity table in the Utilization app lists the systems of the environment with the activity statistics (read/write per second) by tier. The table also includes the total number of objects or segments moved per minute for the public cloud and private cloud tiers. The activity graphs show up to one month of data.
Under the workspace heading, click the hostname of a system to update the Utilization app to show the statistics and hostname utilization for the system. Then the table lists the file systems for the system, and clicking the name of a file system updates the Utilization app to show the statistics for the file system. The table is not shown for the file system view.
If a system or volume does not include a particular tier, the app shows Not Used. Not Used also appears if the data activity for a tier is zero or null.
Use the chart context menu  to view the chart in full screen, print a chart, or download a chart as one of the following file types:
- Portable Network Graphics (PNG)
- Joint Photographic Experts Group (JPEG)
- Portable Document Format (PDF)
- Scalable Vector Graphics (SVG)
- Comma Separated Values (CSV)
-
Excel Spreadsheet (XLS)
Note: If you download and open a file in Excel, you might get a message that the file format and extension do not match. You can safely ignore the message and click Yes to open the file. For more information, see A file is in a different format than its extension indicates in Excel.
- View data table (click this option to display the data as a table within the interface)
| Symptom | Probable Cause |
|---|---|
|
I don't see a system that I expect to be shown in the Workspaces (Clusters) column of the Capacity/Activity table. |
The components in the environment must be discovered prior to monitoring. Use the Discover Components app to see the topology of the StorNext environment. If it is not as expected, try a rediscovery. See Introduction to StorNext Connect Discovery . Also, make sure the latest Connector version is downloaded and installed on all systems. See Install the Connector on Clients. |
|
Not Used is shown for some of the charts and graphs. |
The Not Used message can appear for the following reasons:
If the system is new, allow some time for statistics to reach the StorNext Connect server and render in the Utilization app. It can take 10–30 minutes for metadata and primary storage statistics to load in the Utilization app and 30–60 minutes for archive storage statistics to load after Storage Manager data movement occurs. If a StorNext client in any of the workspaces (clusters) encounters an issue connecting to the StorNext MDC of the workspace, the Not Used message might appear throughout the app. To resolve, fix the connectivity issue on the StorNext client and then rediscover the workspace(s) from the Discover Components app. Also, make sure the version of the system being monitored is StorNext 5.4 or later. |
|
The metadata and primary storage statistics shown in the Utilization app are different than I expected. |
The Utilization app calculates the capacity and usage of metadata and primary storage with the assumption that separate stripe groups are configured for metadata and user data in every volume. If one or more volumes use a combined stripe group (both metadata and user data), the volume(s) with the combined stripe groups are shown in the app as though both metadata and user data have the entire stripe group's available capacity. As a result, the space used in a combined stripe group is counted twice in the metadata and primary storage charts, and both metadata and primary storage values in the historical graph include the space used in the combined stripe group, resulting in the reporting of more space used than actual space used. If some volumes have combined stripe groups, while other volumes have exclusive metadata or exclusive user data stripe groups, the aggregated values are calculated as a weighted average of both configurations. Note: For most Quantum appliances, the HA shared volume is configured using a combined stripe group for metadata and system-implementation data, and the volumes for actual user files are configured with exclusive stripe groups. You can view the volume configuration in the StorNext GUI. See the View a File System section of the StorNext Documentation Center for more information. |
|
The historical graph is not showing data from today. |
The historical usage/future forecast capacity graph shows data summarized once a day according to coordinated universal time (UTC), while the label reports the time zone for the browser system. As a result, data as recent as 00:00 UTC is accounted for in the graph; however, the label shows the local time offset from UTC, which may appear to be earlier. |


