The Remote Management Console
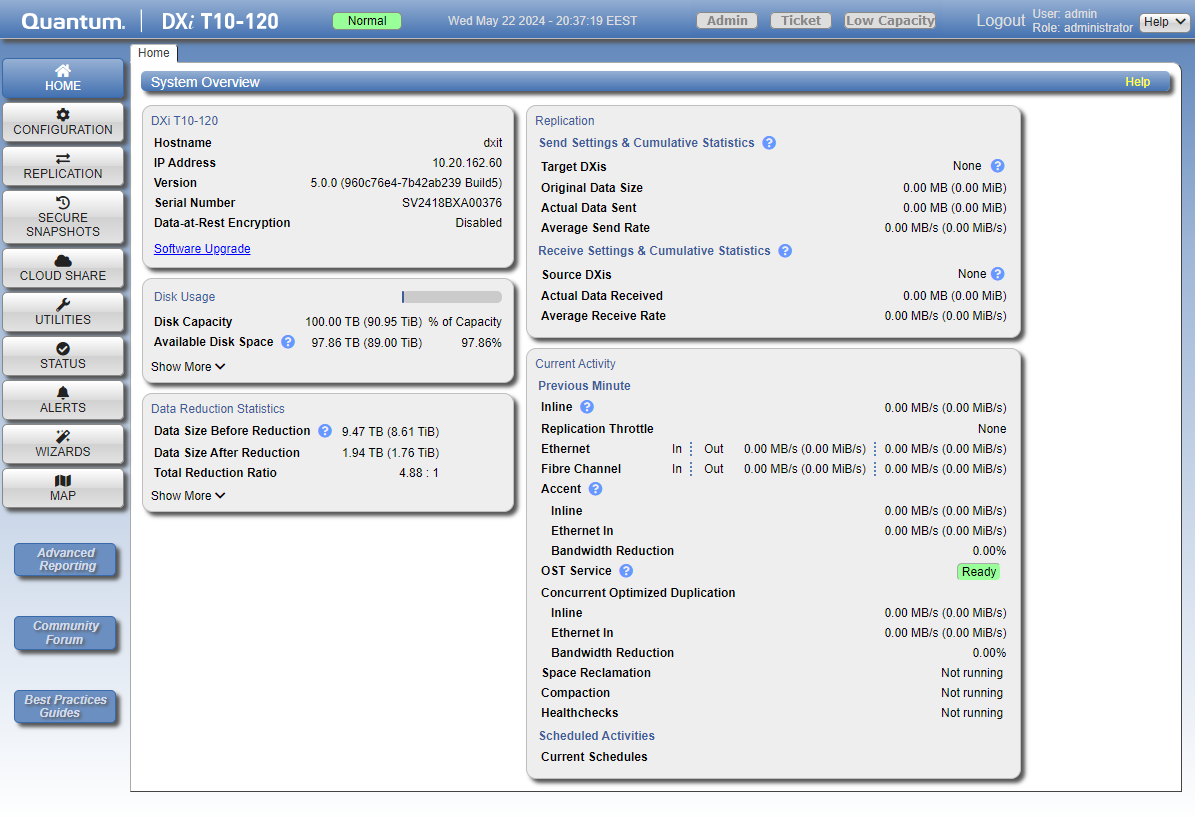
After you log on to the DXi T10, the remote management console displays. The remote management console includes the following features:
The system banner displays at the top of the remote management console. Use the system banner to see overall system status and alert information at a glance, and to quickly access additional information. The system banner also displays the time and date as well as the login type (administrator or monitor).
Note: The DXi T10-60 system banner will be labeled DXi T10-60, the DXi T10-240 system banner will be labeled DXi T10-240, and the the DXi T10-480 system will be labeled DXi T10-480.

The following items display on the system banner.
| Item | Description | |
|---|---|---|
|
Model Number |
The model number of the DXi T10. See Model Number. |
|
| Status |
|
|
| Admin | The Admin button turns yellow when an administration alert occurs. Click the Admin button to manage administration alerts. See Admin Alerts. | |
| Ticket | The Ticket button turns yellow when open service tickets are present. Click the Ticket button to manage service tickets. See Service Tickets. | |
| Low Capacity |
The Low Capacity button turns yellow when available disk space falls to a low level and the DXi T10 enters Low Space state. Click the Low Capacity button to view the administration alerts related to low disk space. See Low Space Management and Admin Alerts. Note: When disk space is low, target replication to the system is paused. In addition, space reclamation and compaction are automatically started to free up disk space. See Replication Service and Space Reclamation. |
|
| Logout | Click to end your remote management session. | |
| User |
Username assigned to the user (admin, monitor, servicegui, LDAP or access control user). Note: User names are in lower case. |
|
| Role |
Role assigned (administrator or monitor). Note: Role names are in lower case. |
|
| Help Menu |
Select from the following help options:
|
The Model Number displays in the DXi T10 System Overview section on the Home page. The model number indicates the specific hardware configuration of the DXi T10.
|
Model Number |
Configuration |
| Quantum DXi T10 |
15 – 60 TB usable for data storage (DXi T10-60) 30 – 120 TB usable for data storage (DXi T10-120) 60 - 24 TB usable for data storage (DXi T10-240) 120 - 480 TB usable for data storage (DXi T10-480). 2 x 10 GBase-T Ethernet ports. (Optional) Up to 4 x 100 GbE Ethernet ports. (Optional) Up to 12 x 10/25 GbE Ethernet ports. (Optional) Up to 6 x 32 Gb Fibre Channel ports (For path to tape and VTL). |
As disk capacity is used and free disk space approaches low levels, the DXi T10 automatically responds as detailed in the table below.
WARNING: If you receive a WARNING, monitor space utilization closely going forward and consider purchasing expansion or modifying system usage.
When the DXi T10 enters the Low Space state, space reclamation and compaction are automatically started to free up disk space. Space reclamation and compaction end when the DXi T10 exits the Low Space state. See Space Reclamation.
When the DXi T10 enters the Critical Reserve Space state, backup ingest is stopped, and target replication to the system is paused. Backup ingest and target replication resume when the DXi T10 exits the Critical Reserve Space state.
Note: The system generates a service ticket and an admin alert when it enters the Low Space, Critical Reserve Space, and No Space states. In addition, a service ticket and an admin alert are generated when Used Disk Space reaches 85% and 95% of total disk capacity.
|
State |
Disk Space Level |
System Actions |
|
Normal (Green) |
Normal disk space |
Low Capacity button is dark. Backup ingest and replication occur as normal. Space reclamation occurs at normally scheduled times. |
|
Low Space (Yellow) |
Low Capacity button is lit. Backup ingest and replication occur as normal. Space reclamation is automatically started. |
|
|
Critical Reserve Space (Red) |
Free Space is less than 250 GB. |
Low Capacity button is lit. Backup ingest and replication are stopped. Space reclamation is automatically started. Note: VTL cartridge metadata files may still be updated. |
|
No Space (Red) |
Note: No Space also occurs if the Used Metadata percentage is 85% or greater. |
Low Capacity button is lit. Backup ingest and replication are stopped. Space reclamation is automatically started. Note: VTL cartridge metadata files may not be updated. |
A blockpool verify operation occurs if data on the system requires repair, for example, after an unexpected shutdown due to a power loss. During a blockpool verify operation, the banner displays the Attention state. Clicking Attention displays the message: A previous unclean shutdown of the DXi T10 has required a data verification to commence. While in this condition the DXi T10 is operational, but performance may be severely degraded.
While a blockpool verify operation is in progress, some system operations are affected.
- Mounting VTL cartridges created prior to the blockpool verify may fail.
- Retrieving data created prior to the blockpool verify may fail.
- Creating and mounting new VTL cartridges should succeed.
- Ingesting new data to new VTL cartridges or using NAS/OST should succeed.
- Sending data that existed prior to the blockpool verify to a replication target may fail.
- Sending new data to a replication target, or receiving replicated data, should succeed.
- Space reclamation and healthchecks will fail.
When the blockpool verify is complete, the banner displays Normal, and the system resumes normal operation
The main menu displays on the left side of the remote management console. Click a menu item to display the corresponding management page.
To access Advanced Reporting, click the Advanced Reporting button below the main menu. DXi T10 Advanced Reporting combines comprehensive performance data logging with powerful visual reporting and analysis tools to help you identify potential problems and optimize system operation. With DXi T10 Advanced Reporting, you can view an array of performance statistics for a DXi T10 system and see how those statistics change over time.
For information about using DXi T10 Advanced Reporting, click the help icon [?] on the upper right of the Advanced Reporting window.
Note: Clicking Wizards on the main menu replaces the main menu with the wizards menu. Click a menu item to begin a wizard, or click Exit to return to the main menu. See Configuration Wizards .

Use the DXi T10 management pages to view information as well as configure and manage the system. To navigate to a page, first click a menu item, then click a tab to display the corresponding page. Some pages include sub-tabs that display pages with additional information and options.
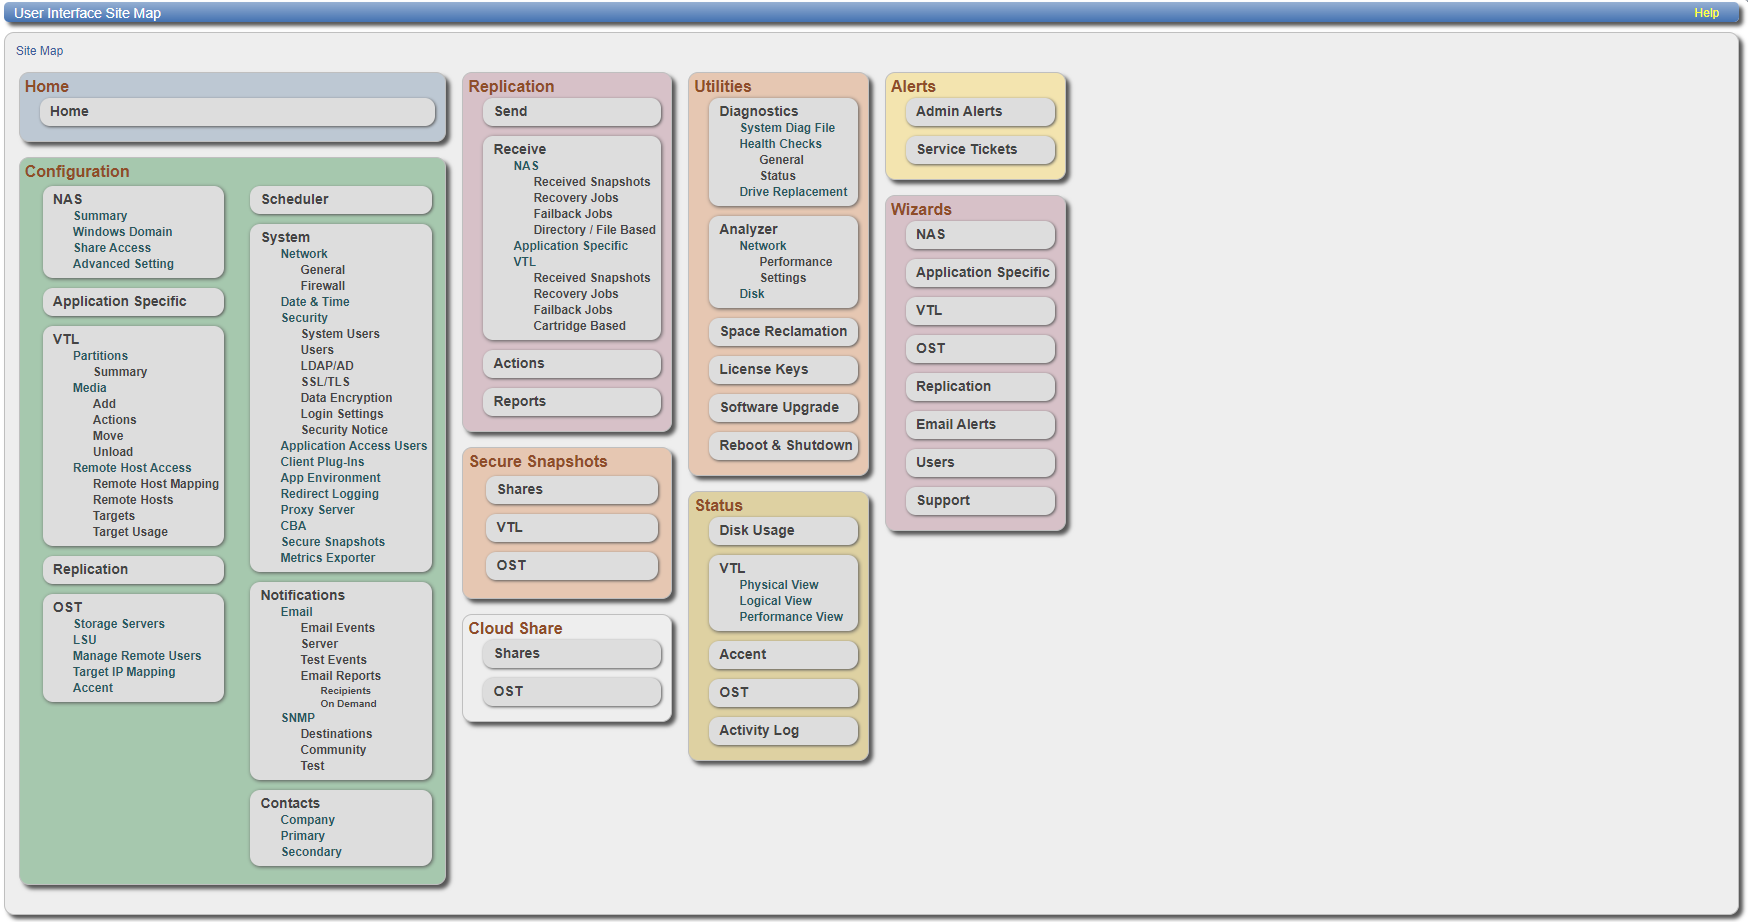
To view a graphical map of all remote management pages, click Map on the main menu. On the map, click the name of a page to quickly navigate to that page.If you need help as you work, click the help icon [?] in the page's title bar to see online help for that page. In addition, Quick Tips are available on many pages. Click the Quick Tip icon [?] next to a section or field to learn more about that item.
Caution: Unless directed to do so by the documentation, do not use your Web browser’s Back, Forward, or Refresh buttons when navigating in the remote management console. Doing so may have unintended effects. Instead, always use the main menu and tabs to navigate in the remote management console.

 minute read
