Reduction Ratio Graph
The Reduction Ratio graph displays the data reduction factor for the
When viewing data on the Reduction Ratio graph, keep in mind that a higher reduction ratio indicates less space is being used to store the same amount of ingested data.
Note: The reduction ratio may vary greatly during space reclamation and during incoming replications because these activities affect the Before Reduction amounts.
Review the following variables of the graph.
Figure 1: Reduction Ratio Graph
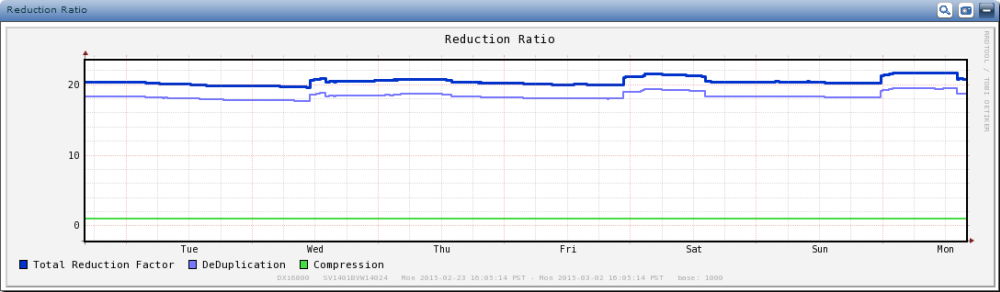
Displays the factor when the Before Reduction value is divided by the After Reduction value.
Note: This value corresponds to the Total Reduction Ratio value on the Home page of the
Displays the reduction factor for deduplication. This factor is calculated by dividing the Before Reduction value by the Unique Data value.
Note: View the Before Reduction and Unique Data values on the Data Volume Overview Graph.
Displays the reduction factor for compression. This factor is calculated by dividing the Unique Data value by the After Reduction value.
Note: View the Unique Data and After Reduction values on the Data Volume Overview Graph.