Ingest (Chargeback) – Capacity Graphs
The Capacity graphs display the amount of data sent to the
Note: For the purpose of this document, screen shots are of the Per Partition Ingest report. All three reports use the same data sets and interface.
Shows the amount of data sent to a single partition or share on the appliance for backup, or the amount of data within a partition or share sent to the appliance for replication.
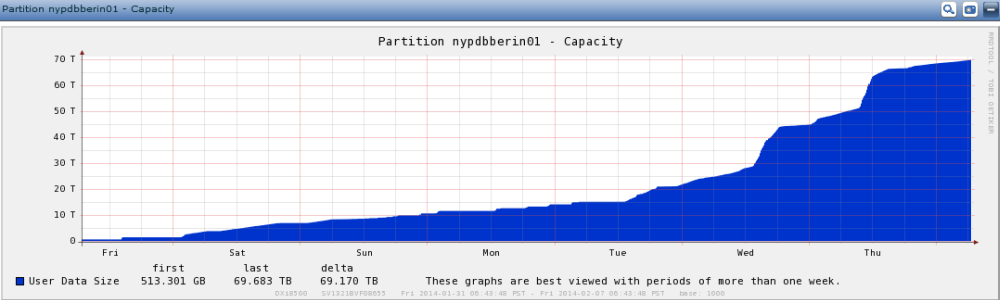
Figure 1: Partition <name> – Capacity graph
The Capacity graphs display the following information for the type of data — total capacity or per partition/share capacity — on which statistics are being reported:
The graph displays one of the following:
- The total amount of data coming into the appliance for backup or replication from all sources for each minute during the selected time range.
- The amount of data coming into a single partition or share for backup for each minute during the selected time range.
- The amount of data within a partition or share being replicated to the appliance for each minute during the selected time range.
The graph's legend shows the first and last data points for the selected time range, and the difference between the two points.
Note: Capacity displayed for the last minute of the graph corresponds to the UserDataSize value in the exported Chargeback Ingest comma separated value (CSV) file. See Exporting a Chargeback Ingest File.