|
|
The following information applies to version 6 (or later) of the Monitor Performance application. Do you need to install or update the Monitor Performance app? See Manage Applications for instructions about the App Store. |
Caution: If NTP is not configured, and a system in the environment transmits statistics to StorNext Connect with a time that is later than the time on the StorNext Connect server, the stats are discarded and StorNext Connect does not report accurate monitoring stats.
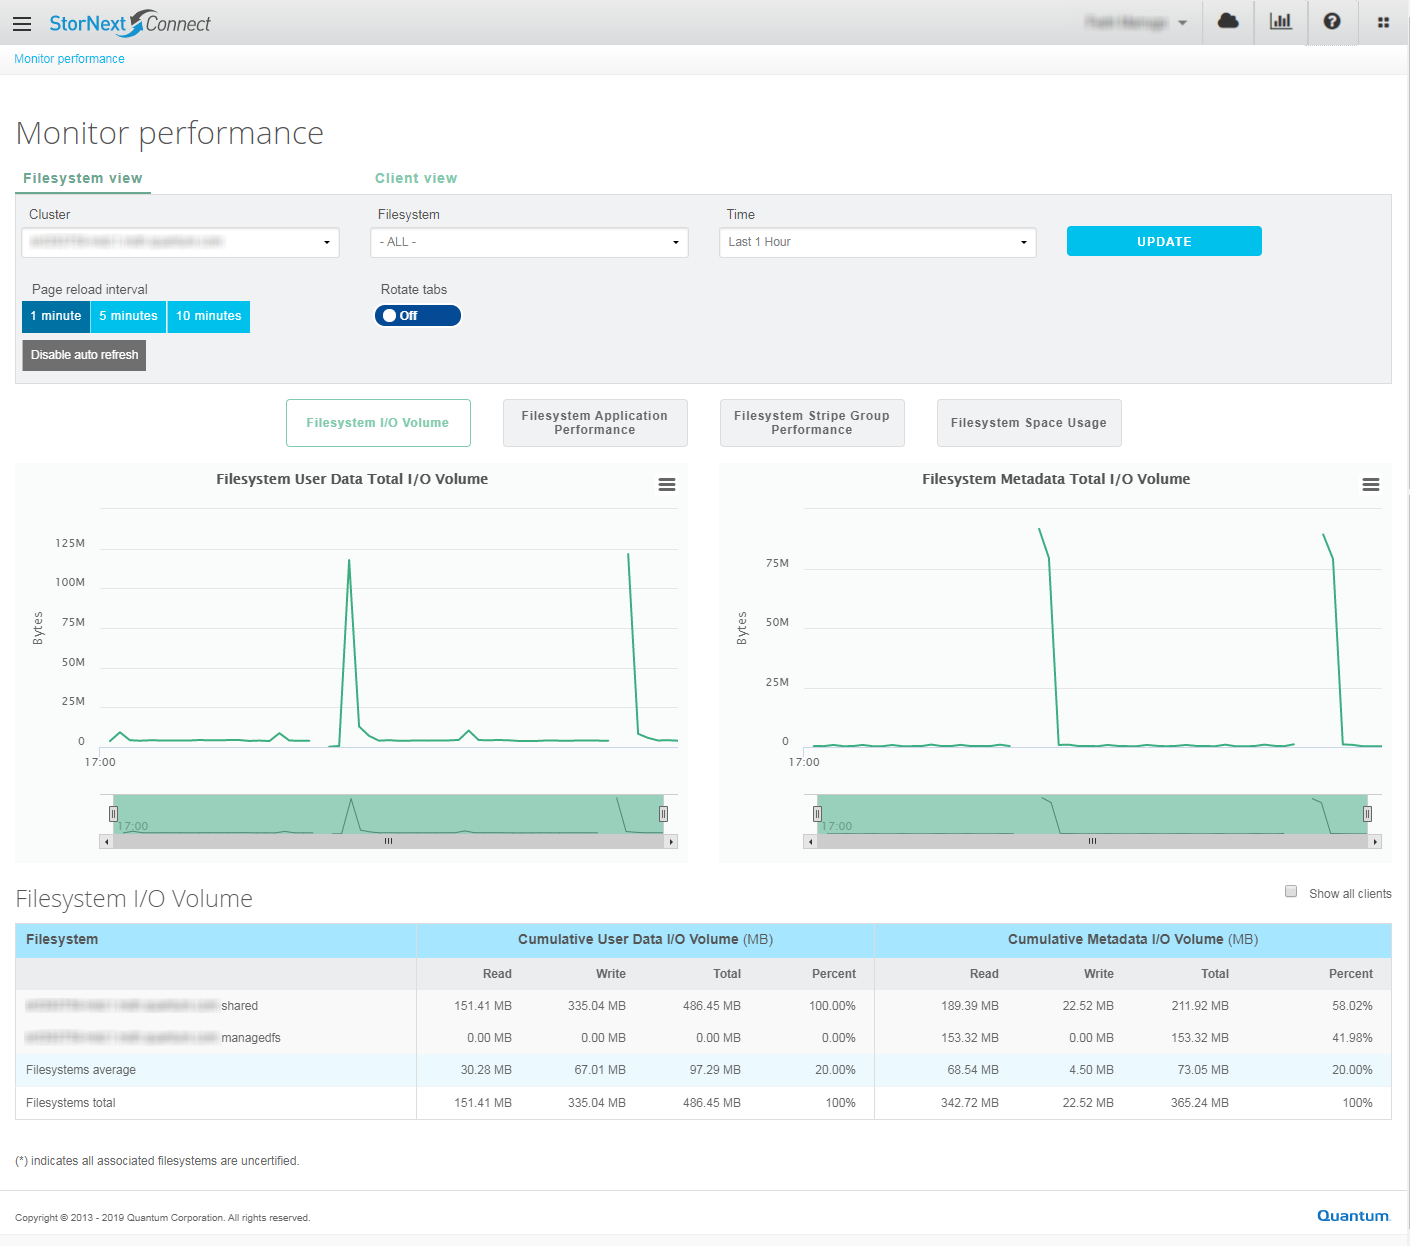
The Monitor Performance application allows you to monitor the performance and capacity usage of StorNext volumes (file systems). You can view performance based on specific volumes (file systems) on the Volume view / File System view or specific clients on the Client view. You can further filter the results by workspace (cluster), volume (file system), client, or time.
Note: When you monitor file systems where the metadata and data share the same LUNs, the free space remaining for either metadata or data is affected by both the metadata and data usage.

Do the following to view file system I/O volume performance data.
Note: The Volume view / File System view > File System I/O Volume counts I/O activity from and to DLC clients once for the DLC client and a second time for the DLC server/gateway (SAN client).
- Click the Hamburger icon.
- Click Monitoring.
-
Click Monitor Performance. The Monitor performance page appears.
- Click Filesystem view.
- Click Filesystem I/O Volume.
- (Optional) Click Show all clients to display all of the clients in your environment. By default, this option is disabled.
Do the following to view file system application performance data.
- Click the Hamburger icon.
- Click Monitoring.
-
Click Monitor Performance. The Monitor performance page appears.
- Click Filesystem view.
- Click Filesystem Application Performance.
- (Optional) Click Show all clients to display all of the clients in your environment. By default, this option is disabled.
Do the following to view file system stripe group performance data.
- Click the Hamburger icon.
- Click Monitoring.
-
Click Monitor Performance. The Monitor performance page appears.
- Click Filesystem view.
- Click Filesystem Stripe Group Performance.
- (Optional) Click Show all stripe groups to display all of the stripe groups in your environment. By default, this option is disabled.
Do the following to view file system space usage.
- Click the Hamburger icon.
- Click Monitoring.
-
Click Monitor Performance. The Monitor performance page appears.
- Click Filesystem view.
- Click Filesystem Space Usage.
- (Optional) Click Show all stripe groups to display all of the stripe groups in your environment. By default, this option is disabled.
Do the following to view client I/O volume performance data.
- Click the Hamburger icon.
- Click Monitoring.
-
Click Monitor Performance. The Monitor performance page appears.
- Click Client view.
- Click Client I/O Volume.
- (Optional) Click Show all filesystems to display all of the file systems in your environment. By default, this option is disabled.
Do the following to view client performance data.
- Click the Hamburger icon.
- Click Monitoring.
-
Click Monitor Performance. The Monitor performance page appears.
- Click Client view.
- Click Client Performance.
- (Optional) Click Show all filesystems to display all of the file systems in your environment. By default, this option is disabled.
Switch between views or click Update to update the information on the screen. To update information based on different filters, select the filter options from the drop-down lists, and then click Update.
The page reload interval indicates how frequently the data on the page is reloaded (refreshed). The default is 1 minute.
To configure the page reload interval, click one of the time interval buttons:
- 1 minute
- 5 minutes
- 10 minutes
-
Disable auto refresh (click to disable the page reload interval feature)
Note: This option also disables the Rotate tabs feature. See Alternate the Data Being Displayed in Conjunction with the Page Reload Interval.
You can switch between alternating the data and tables to display in conjunction with the specified page reload interval. For example, if you enable Rotate tabs and specify a 1 minute page reload interval, then the data and tables displayed alternate sequentially (every minute) between the following tabs:
- Filesystem I/O Volume
- Filesystem Application Performance
- Filesystem Stripe Group Performance
- Filesystem Usage
In this example, the data and tables are displayed as follows:
- Filesystem I/O Volume (1 minute timer begins)
- (after 1 minute, the data for the following appears) Filesystem Application Performance
- (after 2 minutes, the data for the following appears) Filesystem Stripe Group Performance
- (after 3 minutes, the data for the following appears) Filesystem Usage
- (after 4 minutes, cycle begins again and the data for the following appears) Filesystem I/O Volume
- ...and so on.
To enable the Rotate tabs feature, do the following:
-
On the Monitor performance page, click one of the following buttons to configure the page reload interval:
- 1 minute
- 5 minutes
- 10 minutes
-
To turn the Rotate tabs feature on or off, click Rotate tabs.
Use the chart context menu  to view the chart in full screen, print a chart, or download a chart as one of the following file types:
- Portable Network Graphics (PNG)
- Joint Photographic Experts Group (JPEG)
- Portable Document Format (PDF)
- Scalable Vector Graphics (SVG)
- Comma Separated Values (CSV)
-
Excel Spreadsheet (XLS)
Note: If you download and open a file in Excel, you might get a message that the file format and extension do not match. You can safely ignore the message and click Yes to open the file. For more information, see A file is in a different format than its extension indicates in Excel.
- View data table (click this option to display the data as a table within the interface)


