Caution: If NTP is not configured, and a system in the environment transmits statistics to StorNext Connect with a time that is later than the time on the StorNext Connect server, the stats are discarded and StorNext Connect does not report accurate monitoring stats.
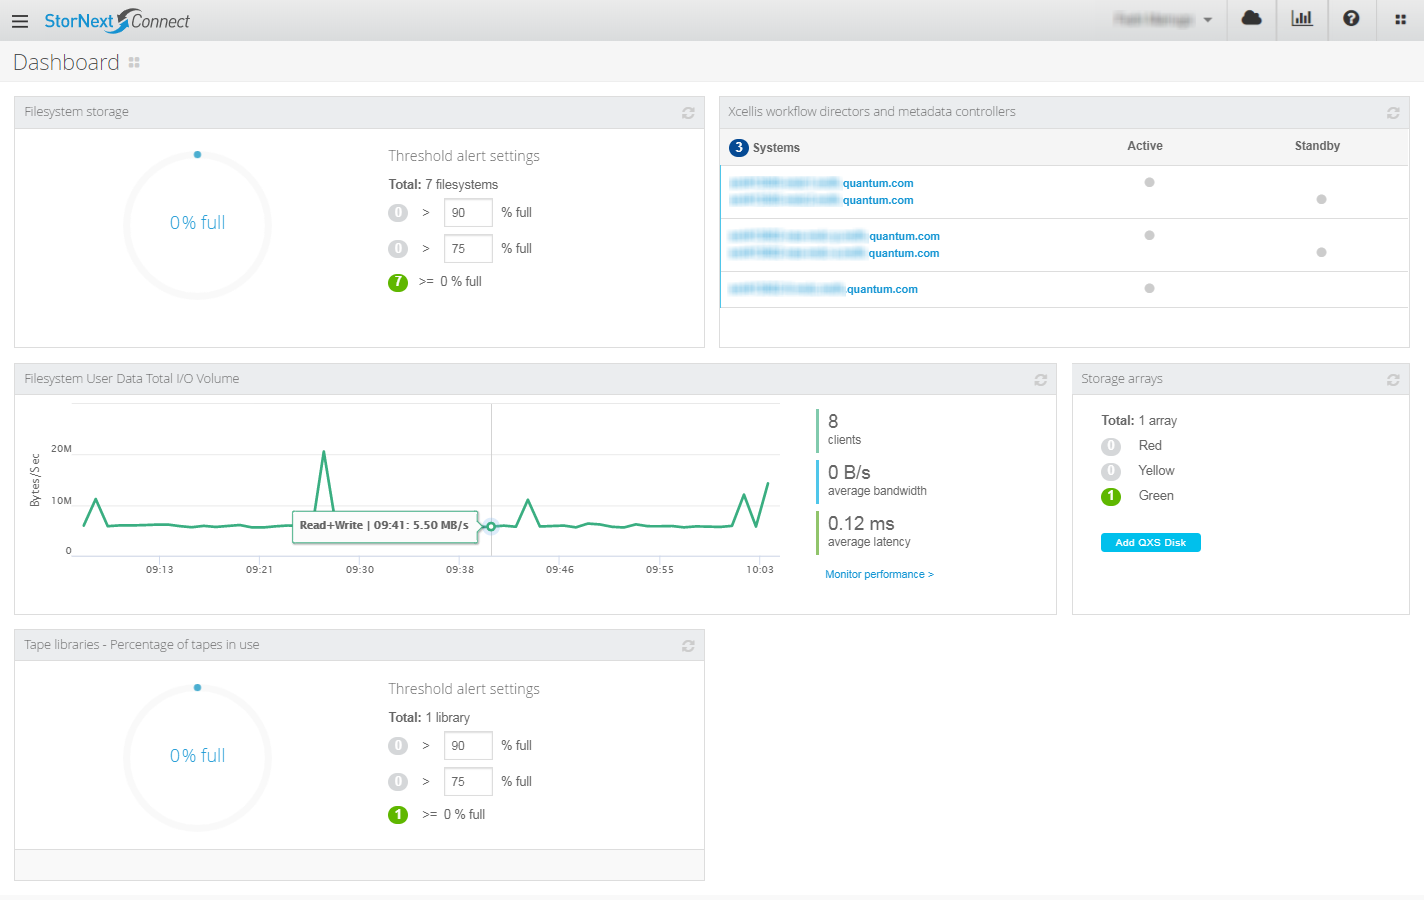
The Dashboard allows you to monitor the health of your storage, including servers and QXS storage. Through "widgets," the Dashboard provides information about volume storage, data I/O throughput, Xcellis Workflow Director systems and StorNext MDCs (metadata controllers), storage arrays, and tape libraries.

The Filesystem data I/O throughput widget is refreshed automatically every 60 seconds. Other statistics displayed and thresholds set on the Dashboard do not automatically update. Click ![]() on a widget to apply updates and refresh the information.
on a widget to apply updates and refresh the information.
This widget monitors your file system's capacity based on customizable thresholds.
Type the desired values into the Threshold alert settings boxes, or use the increment/decrement buttons that appear when you place your cursor over a box.
- Set the threshold in the bottom box to any value from 50% to 79%.
- Set the threshold in the top box to any value from 80% to 99%.
As the file system's used capacity reaches the thresholds, the numbers in the green, yellow, and red dots update accordingly when you refresh the widget or screen. If zero volumes are within a certain threshold (for example, no volumes are greater than 80% full), that threshold's dot is gray.
The x% full circle to the left of the thresholds shows the aggregate percent of total capacity used across the whole environment. Click the Monitor performance link to go directly to the Monitor performance page.
- Click one of the dots to display the file systems currently within the selected threshold, or click the X% full circle to view all file systems.
- Click a file system link to display the Monitor performance page for the selected file system.
- Click the arrow in the upper right corner of the widget to return to the Dashboard.
Use this widget to monitor the health of the Quantum appliance server node(s) in their monitored environment.
Click a hostname link to launch the server's management interface, where you can perform additional management and troubleshooting tasks.
Depending on the status of your system(s), the following appears on the widget to reflect the number of systems:
- 0 - No Systems
- 1 - System
- n - Systems (where n is greater than or equal to 2)
The following table identifies the widget status indicators.
|
Indicator Color |
Status |
|---|---|
|
Green |
Optimal |
|
Yellow |
Degraded |
|
Red |
Failed |
Use this widget to see an aggregate of average bandwidth and latency between all clients and volumes in the environment. Place your cursor over individual bars in the graph to see details for a specific minute on the time-line.
Click the Monitor performance link to display the Monitor performance page.
Use this widget to view overall health status of your data and metadata storage.
- Click the Green, Yellow, and Red dots to view the hostnames of the storage arrays that have the selected status.
- Click a hostname link to launch the array's management interface, where you can perform additional management and troubleshooting tasks.
- Click the arrow in the upper right corner of the widget to return to the Dashboard.
Within this widget, you can also click the Add QXS Disk button to manage the QXS disks that StorNext Connect monitors. See Manage QXS for details.
This widget monitors the percentage of tape libraries that are in use based on customizable thresholds.
Type the desired values into the Threshold alert settings boxes, or use the increment/decrement buttons that appear when you place your cursor over a box.
- Set the threshold in the bottom box to any value from 50% to 79%.
- Set the threshold in the top box to any value from 80% to 99%.
As the percentage of tape libraries that are in use reaches the thresholds, the numbers in the green, yellow, and red dots update accordingly when you refresh the widget or screen. If there are zero tape libraries that are in use within a certain threshold (for example, no tape libraries that are in use are greater than 80%), that threshold's dot is gray.
The x% full circle to the left of the thresholds shows the aggregate percent of the total tape libraries used across the whole environment.
- Click one of the dots to display the tape libraries currently in use within the selected threshold, or click the X% full circle to view all tape libraries.
- Click a tape library link to launch the management interface, where you can perform additional management and troubleshooting tasks.
- Click the arrow in the upper right corner of the widget to return to the Dashboard.
