Monitor the System
The System Overview page displays metrics related to capacity, system performance, durability policy, power usage, CPU and memory usage, replication, and S3.
Table 1: Tabs on the System Overview page
|
Tab |
Description |
| Capacity |
Displays the raw storage capacity of the environment. |
| System Performance |
Displays the read and write throughputs as transactions per second and response time in milliseconds. |
| Durability Policy |
Displays the system's durability policy. |
| Power |
Displays power metrics for systems with recognized PDUs. |
| System |
Displays CPU and memory usage. |
| S3 |
Displays S3 metrics. |
| Replication |
Displays replication metrics. |
The system bucket is a special S3 bucket that is only accessible to identities that have been granted permission by the system administrator.
Table 2: System bucket contents
|
Path |
Description |
|---|---|
|
system/machines/environmentGUID_machineGUID/audit/ |
Compressed web service audit logs. Retained for 30 days. Contents:
|
|
system/machines/environmentGUID_machineGUID/coredumps/ |
Compressed Linux kernel and application core dumps . Retained for 30 days. |
|
system/machines/environmentGUID_machineGUID/evidence_bundle/ |
Reliability Engine disk evidence bundles. Retained for 30 days. The Reliability Engine runs on all nodes. When there are potential drive issues, it collects an evidence bundle intended for Quantum Support containing binary-encoded information for troubleshooting. Contents:
|
|
system/machines/environmentGUID_machineGUID/logs/ |
Compressed ActiveScale OS logs, grouped per module. Retained for 90 days. Contents: Management framework web logs: the log files from the System Nodes and Storage Nodes. These log files contain:
Application server model interactions:
|
|
system/machines/environmentGUID_machineGUID/metering/scalerdaemonGUID/ |
Compressed metering logs. Retained for 90 days. Contents:
|
|
system/machines/environmentGUID_machineGUID/system |
Compressed Linux logs. Retained for 90 days. Contents:
|
|
system/machines/ environmentGUID_machineGUID/telemetry |
Temporary storage of telemetry data before the system forwards it to an Quantum destination once every 24 hours. Retained for 90 days. A telemetry agent runs on all nodes, collecting data at various frequencies, encrypting that data using asymmetric keys, and uploading it to the system bucket. From there, the data is sent to an Quantum destination every 24 hours using SSL for transport. Contents:
|
|
system/reports/ bucket_capacity/ |
System-wide and per-bucket capacity information. Retained for 90 days. Contents:
Filename:
|
|
system/reports/ACL/ |
System-wide and per-bucket ACL information. Retained for 30 days. Filename:
|
|
system/reports/ disaster_recovery/ |
Backups of per-bucket encryption keys. These backups are also called daily disaster recovery reports. Retained for 5 days. |
|
system/reports/object_verifier/ |
Compressed reports of system verification workflows. These reports do not need to be regularly monitored. The event INTERNAL_INCONSISTENCY_DETECTED will be raised if there is content to review. Filename: time_stamp.object_verifier_report.csv.gz |
|
upgrades/ |
ActiveScale OS upgrade images. |
|
telemetry/ |
System-wide and per-account quota reports. Retained for 90 days. Filename: account_ID.quota.csv.gz |
For instructions on accessing the system bucket, see Grant Access to the System Bucket.
Generate
You can generate billing invoices based on capacity reports. Get capacity reports from the system bucket. For instructions on accessing the system bucket, see Grant Access to the System Bucket. For details about the contents of capacity reports, see Get Reports.
Get
Capacity reports are CSV files containing the capacity information per bucket or volume. Each row in the CSV file lists the capacity usage as well as any applicable feature enabled on the bucket or volume, except for the first 3 lines in the report which are special.
The first row in a capacity report lists the headers, please refer to the table below for more information on each header.
The second row represents the aggregate result of the entire system (including all buckets and volumes) and is identified by the name .total_capacity and owner “.”.
The third row represents the total FILE capacity, i.e. the sum of all volumes.
Capacity reports are stored in the system bucket with the prefix reports/bucket_capacity/. They can be retrieved using an S3 GET call. For instructions on accessing the system bucket, see Grant Access to the System Bucket.
| Header | Description |
|---|---|
| ID | The identifier of bucket or volume. |
| Name | The name of bucket or volume. |
| Owner | The account identifier of the owner of the bucket or volume. The owner is the billable entity. |
| Creation Time UTC | The UTC date and time when the bucket or volume was created. |
| Object Count |
The total number of objects (including all versions) in the bucket¹. Note: This does not include ongoing multipart uploads. |
| Object Byte Count |
The aggregate number of bytes used by all objects in the bucket¹. Note: This does not include the capacity used by ongoing multipart uploads. |
| File Count | The number of files². |
| File Byte Count | The aggregate number of bytes used by all files². |
| Part Count | The number of multipart for which the multipart object has not been yet completed¹. |
| Part Byte Count | The aggregate number of bytes used by multipart parts for which the multipart object has not yet been completed¹. |
| Job Started UTC | The UTC date and time when the calculation of the bucket capacity is initiated¹. |
| Job Finished UTC | The UTC date and time when the calculation of the bucket capacity is completed¹. |
| Versioning Status | Flag indicating the versioning status of the bucket¹. Possible values: enabled/disabled. |
| OLM Status | Flag indicating the object lifecycle management status of the bucket¹. Possible values: enabled/disabled. |
| Replication Status | Flag indicating the replication status of the bucket¹. Possible values: enabled/disabled. |
| Current Object Count | The number of current objects in the bucket, excluding any noncurrent versions¹. |
| Current Object Byte Count | The aggregate number of bytes used by all current objects, excluding any noncurrent versions, in the bucket¹. |
| Type | Type of data stored in this entry: OBJECT for S3 buckets, FILE for NFS volumes. |
| Object Notification Status | Flag indicating the object notification status of the bucket¹. Possible values: enabled/disabled. |
| RestoreCopy Object Count | The total number of cold storage objects with a restore copy¹. |
| RestoreCopy Object Byte Count | The aggregate number of bytes used by the restore copies of cold storage objects¹. |
| Current RestoreCopy Object Count | The number of current cold storage objects with a restore copy, excluding any noncurrent version, in the bucket¹. |
| Current RestoreCopy Object Byte Count | The aggregate number of bytes used by the restore copies of current cold storage objects, excluding any noncurrent version, in the bucket¹. |
| <STORAGE CLASS> Object Count | The total number of objects with storage class <STORAGE CLASS>¹,³ in the bucket. |
| <STORAGE CLASS> Object Byte Count | The aggregate number of bytes used by all object with storage class <STORAGE CLASS> in the bucket¹,³. |
| <STORAGE CLASS> Current Object Count | The number of current objects with storage class <STORAGE CLASS>, excluding any noncurrent versions, in the bucket¹,³. |
| <STORAGE CLASS> Current Object Byte Count | The aggregate number of bytes used by all current objects with storage class <STORAGE CLASS>, excluding any noncurrent versions, in the bucket¹,³. |
| Current Locked Object Count | The number of objects protected with an active lock¹. |
| Current Locked Object Byte Count | The aggregate number of bytes protected with an active lock¹. |
| Expired Retention Locked Object Count | The number of objects with an expired lock¹. |
| Expired Retention Locked Object Byte Count | The aggregate number of bytes with an expired lock¹. |
| Account Display Name | The display of the owning account. |
| Storage Class |
|---|
| STANDARD |
| GLACIER |
| DEEP_ARCHIVE |
| STANDARD_IA |
| REDUCED_REDUNDANCY |
| ONEZONE_IA |
| INTELLIGENT_TIERING |
| GLACIER_IR |
Disaster reports contain the latest saved encryption key database. Best practice is to save this report outsideof the system daily to enable recovery from data loss in case of rare catastrophic events.
-
Get the disaster report from the system bucket's disaster recovery directory,
system/reports/disaster_recovery/. Sample filename: 2016-08-23_11:24:52.434.bucket_encryption_keys.csv.gz
-
For instructions on retrieving information from the system bucket, see Grant Access to the System Bucket. Save the file outside of the ActiveScale system.
Note: When transferring this file to another medium or node, use an encrypted channel (like sFTP) or encrypt the export.
The metering logs are CSV files which log one or multiple entries per S3 request received by ActiveScale. Each row in the metering logs shows details such as the request type, time as well as information on the client performing the request. The metering log entries are appended at the end of each request. ActiveScale attempts to log malformed requests, but some malformed requests might not be logged.
The first row in a metering log lists the headers, please refer to the table below for more information on each header.
Depending on the request some fields will not be filled in or filled in with default values.
The metering logs are stored in the system bucket under the prefix machines/<deployment_id>_<machine guid>/metering/<metering id>/<timestamp>.meter.gz. For instructions on accessing the system bucket, see Grant Access to the System Bucket.
| Header | Description |
|---|---|
| type | The request type (s3_request, batch or internal). |
| timestamp | The start time of the request in epoch. |
| bucketid | The bucket identifier. |
| resourcetype | The resource type of the request (service, bucket, object or part). |
| httpmethod | The HTTP method of the request. |
| userid | The user id which performed the request (base64 encoded). |
| result | The result of the request (SUCCESS or ERROR). |
| bytes | The number of bytes transferred during the request. |
| sourceip | The internal source IP of the request. |
| forwardedfor | The IP of the client (base64 encoded). |
| accountid | The account id which performed the request (base64 encoded). |
| apikey | The access key ID used to authenticate the request (base64 encoded). |
| forwardedproto | The HTTP protocol used for the request (base64 encoded). |
| bucket | The name of bucket (RFC 3986 encoded). |
| key | The key of the object (RFC 3986 encoded). |
| totaltime | The total duration of the request in milliseconds. |
| requestid | The request ID. |
| operation | The type of the logged operation. |
| useragent | The user agent of the client (RFC 3986 encoded). |
| inputversionid | The version ID specified in the request (RFC 3986 encoded). |
| outputversionid | The version ID returned in the response (RFC 3986 encoded). |
-
Click System Overview.
-
Select System.
-
Click Download Report and choose Download CPU Usage CSV Report or Download Memory Usage CSV Report.
View
-
Click System Overview > System.
Figure 1: System Overview > System

-
(Optional) Click Download Report.
Note: The download report option will download the data of the date range selected and displayed on the GUI.
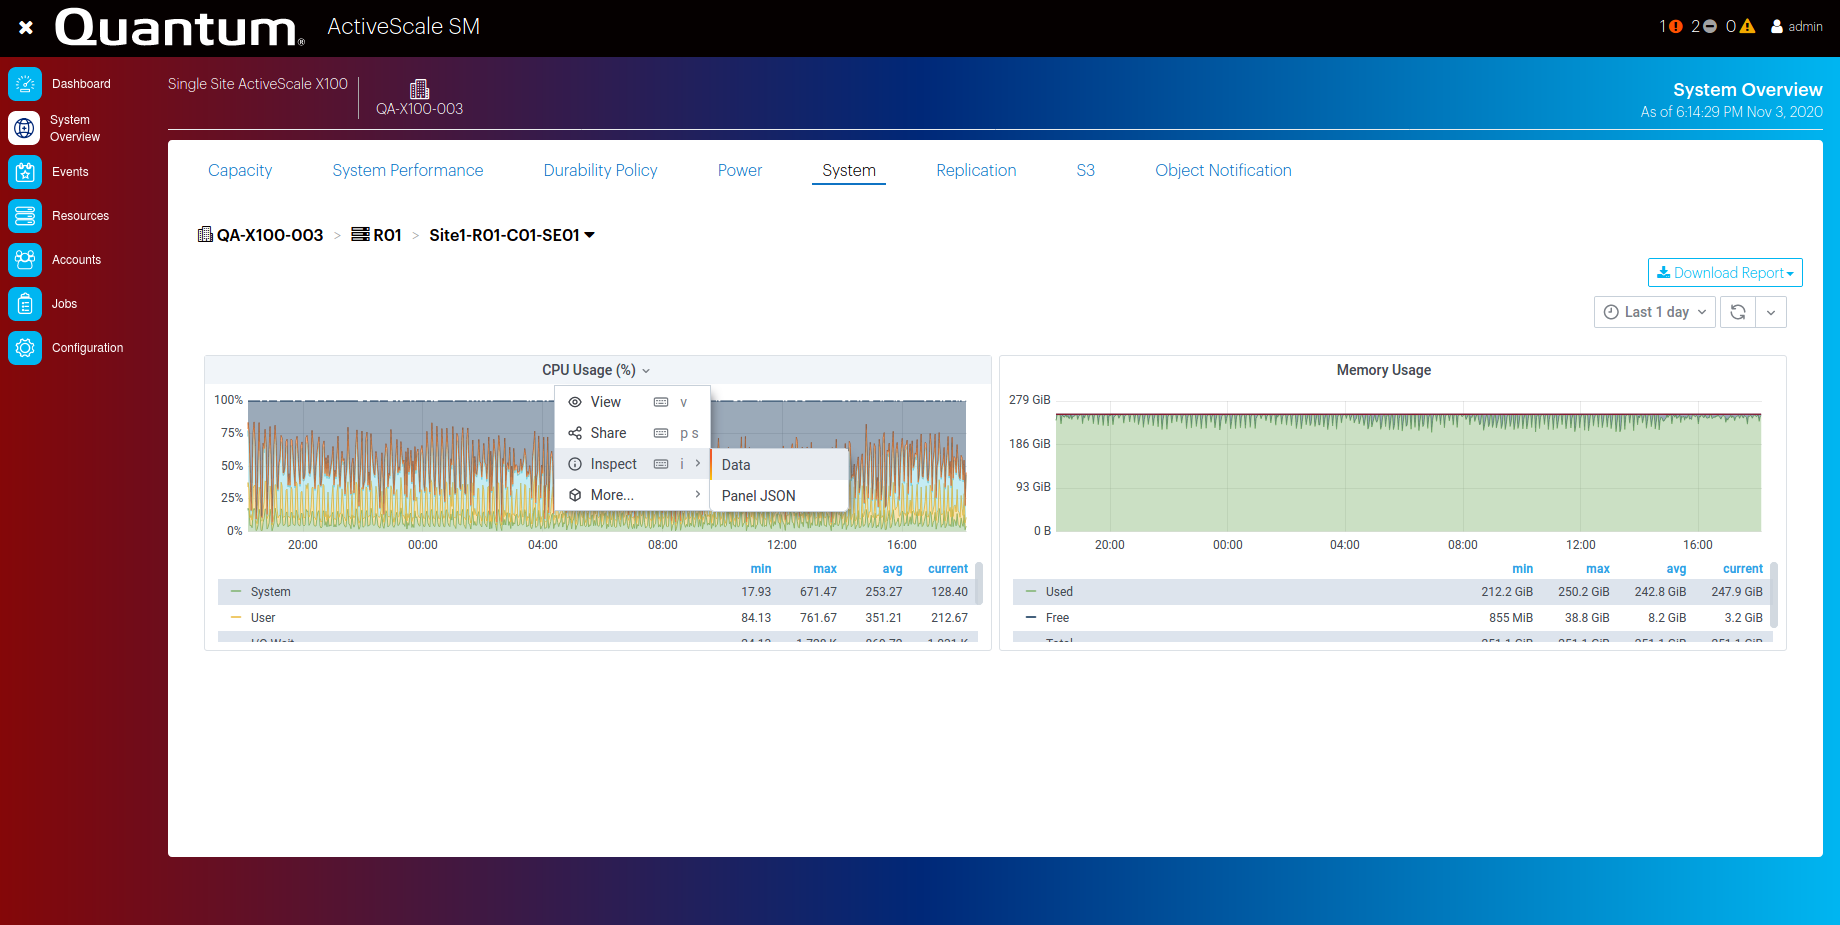
Downloading a CSV version can also be done by performing the following:
-
Click on the panel title.
-
Select Inspect.
-
Select Data.
-
Using the Select result drop-down, pick a time series you want to download. Only one time series can be selected and downloaded at a time.
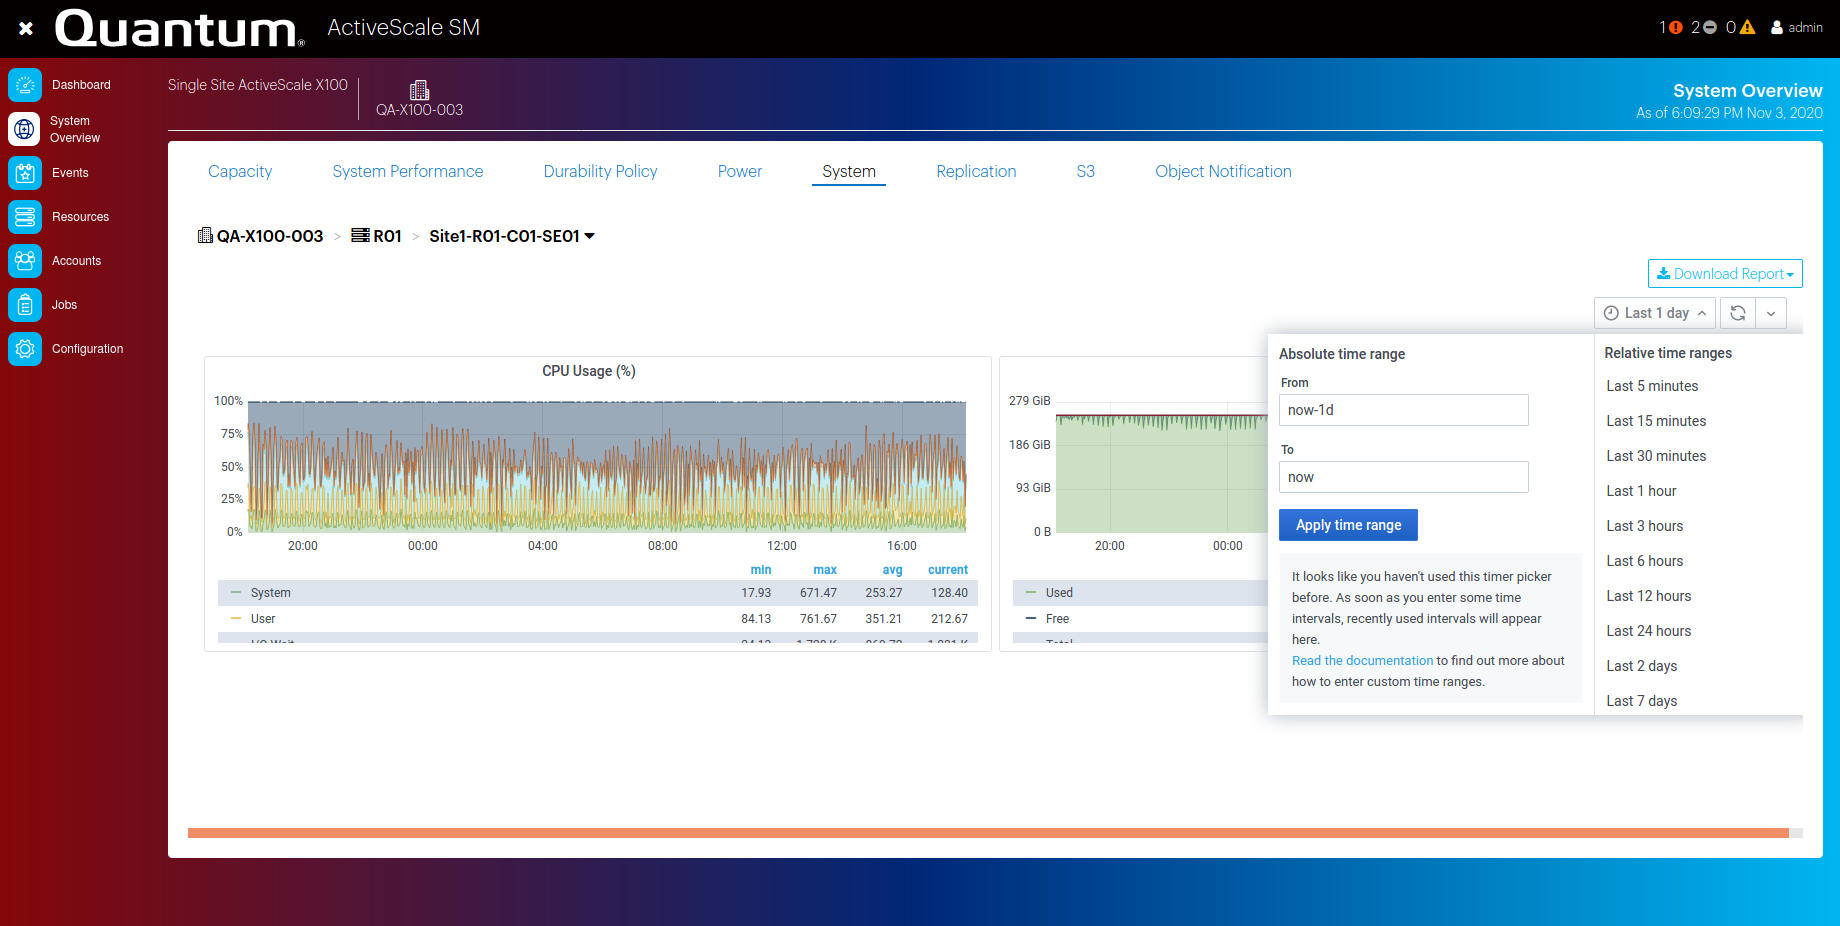
Figure 2: System Overview Download Report Time Selection

Note: By default, ‘Last 1 day’ is selected and only data from the last 24h is displayed. Choosing another time range is possible by clicking the button with the clock icon and either entering an absolute time range or choosing one of the standard relative time ranges in the drop down menu.
-
Click Download CSV.
Figure 3: System Overview >System Download CSV Report

-
Click System Overview > Durability Policy.
Figure 4: System Overview > Durability Policy
-
(Optional) Click Download Report.

Downloading a CSV version can also be done by performing the following:
-
Click on the panel title.
-
Select Inspect.
-
Select Data.
-
Using the Select result drop-down, pick a time series you want to download. Only one time series can be selected and downloaded at a time.
-
Click Download CSV.
-
Click Admin in the menu bar, and select Open source licenses.
Figure 5: Menu bar > Admin > Open source licenses


WARNING: Customer-supplied PDUs may or may not be visible/manageable/monitorable in ActiveScale SM. ActiveScale SM only displays PDUs it recognizes. If your system has PDUs that ActiveScale OS does not recognize, pay close attention to PSU metrics and events instead, because these are your only warning about a loss of power.
Note: Single phase PDUs are not visible/manageable in ActiveScale SM.
-
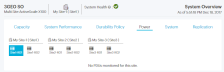
Click System Overview > Power.
-
ActiveScale SM displays a time series of power consumption data. If you have configured email notifications, the system notifies you when a power event arises.
Figure 6: System Overview > Power (for a system with recognized PDUs)
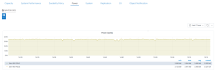
Figure 7: System Overview > Power (for a system with unrecognized PDUs)
Note: By default, ‘Last 1 day’ is selected and only data from the last 24h is displayed. Choosing another time range is possible by clicking the button with the clock icon and either entering an absolute time range or choosing one of the standard relative time ranges in the drop down menu.
Note: By default, ‘1d’ is selected and only the current days data is displayed. Choose ‘1w’, ‘1m’, or ‘All’ to display associated with that selection.


-
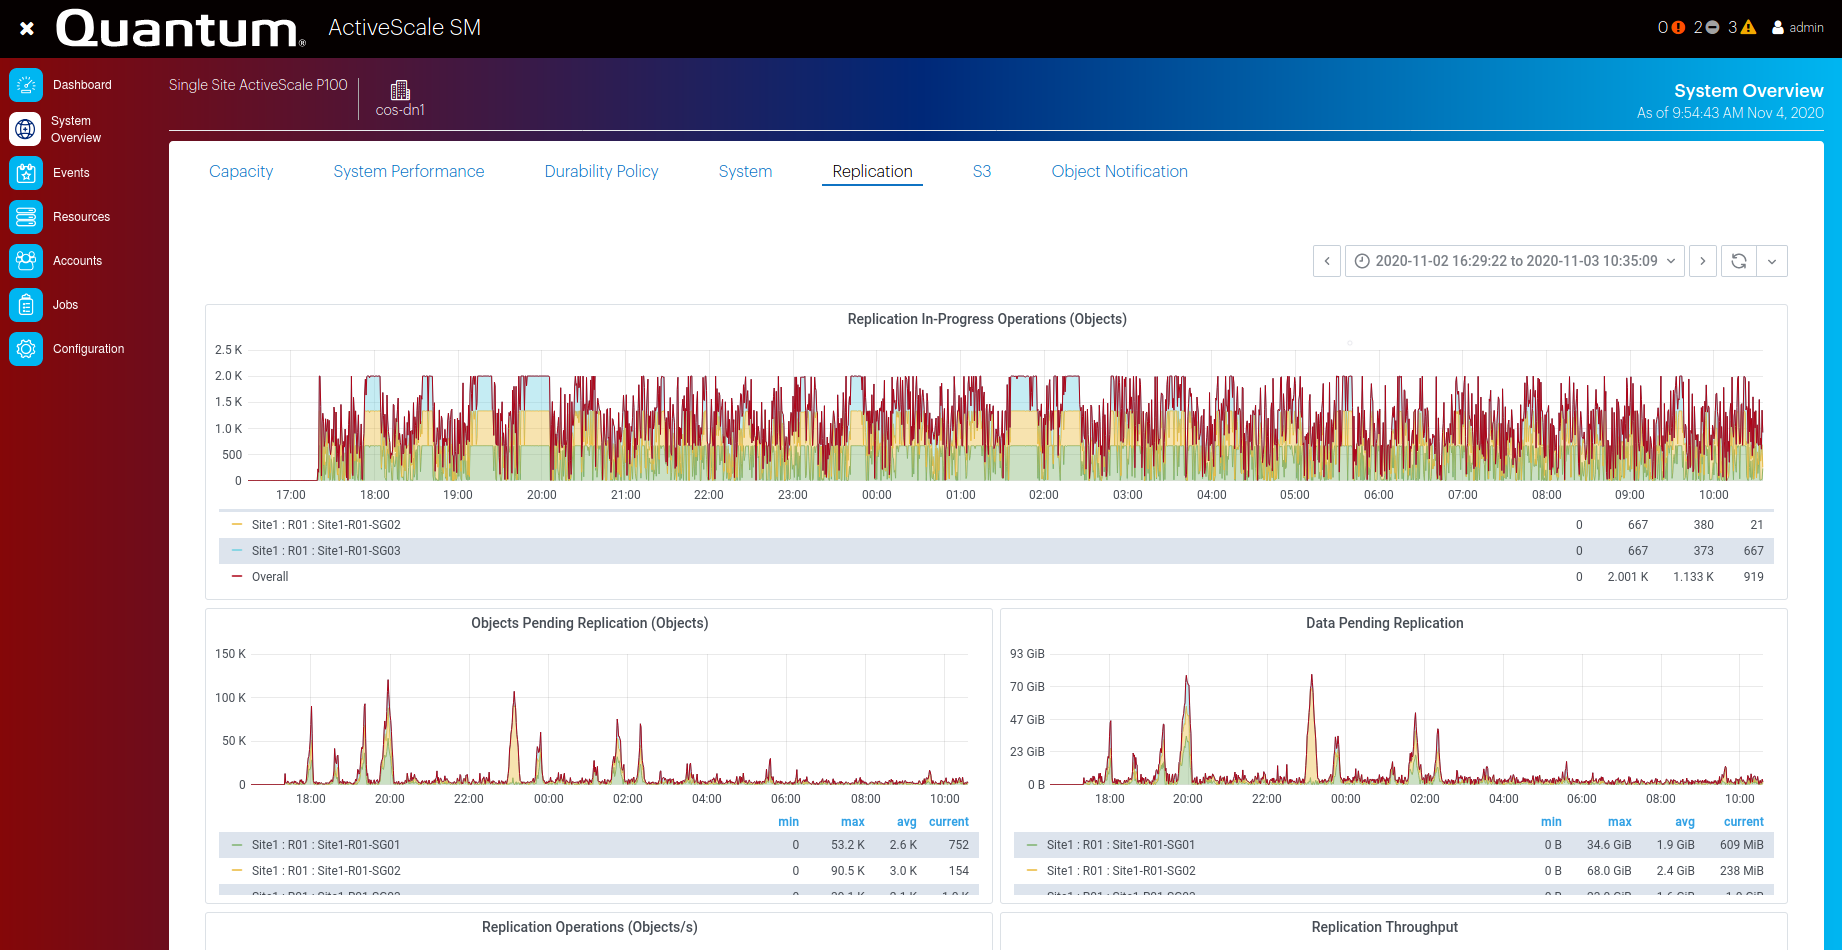
Click System Overview > Replication.
Figure 8: System Overview > Replication
Note: By default, ‘Last 1 day’ is selected and only data from the last 24h is displayed. Choosing another time range is possible by clicking the button with the clock icon and either entering an absolute time range or choosing one of the standard relative time ranges in the drop down menu.
-
Click System Overview > Object Notification.
Figure 9: System Overview > Object Notification
-
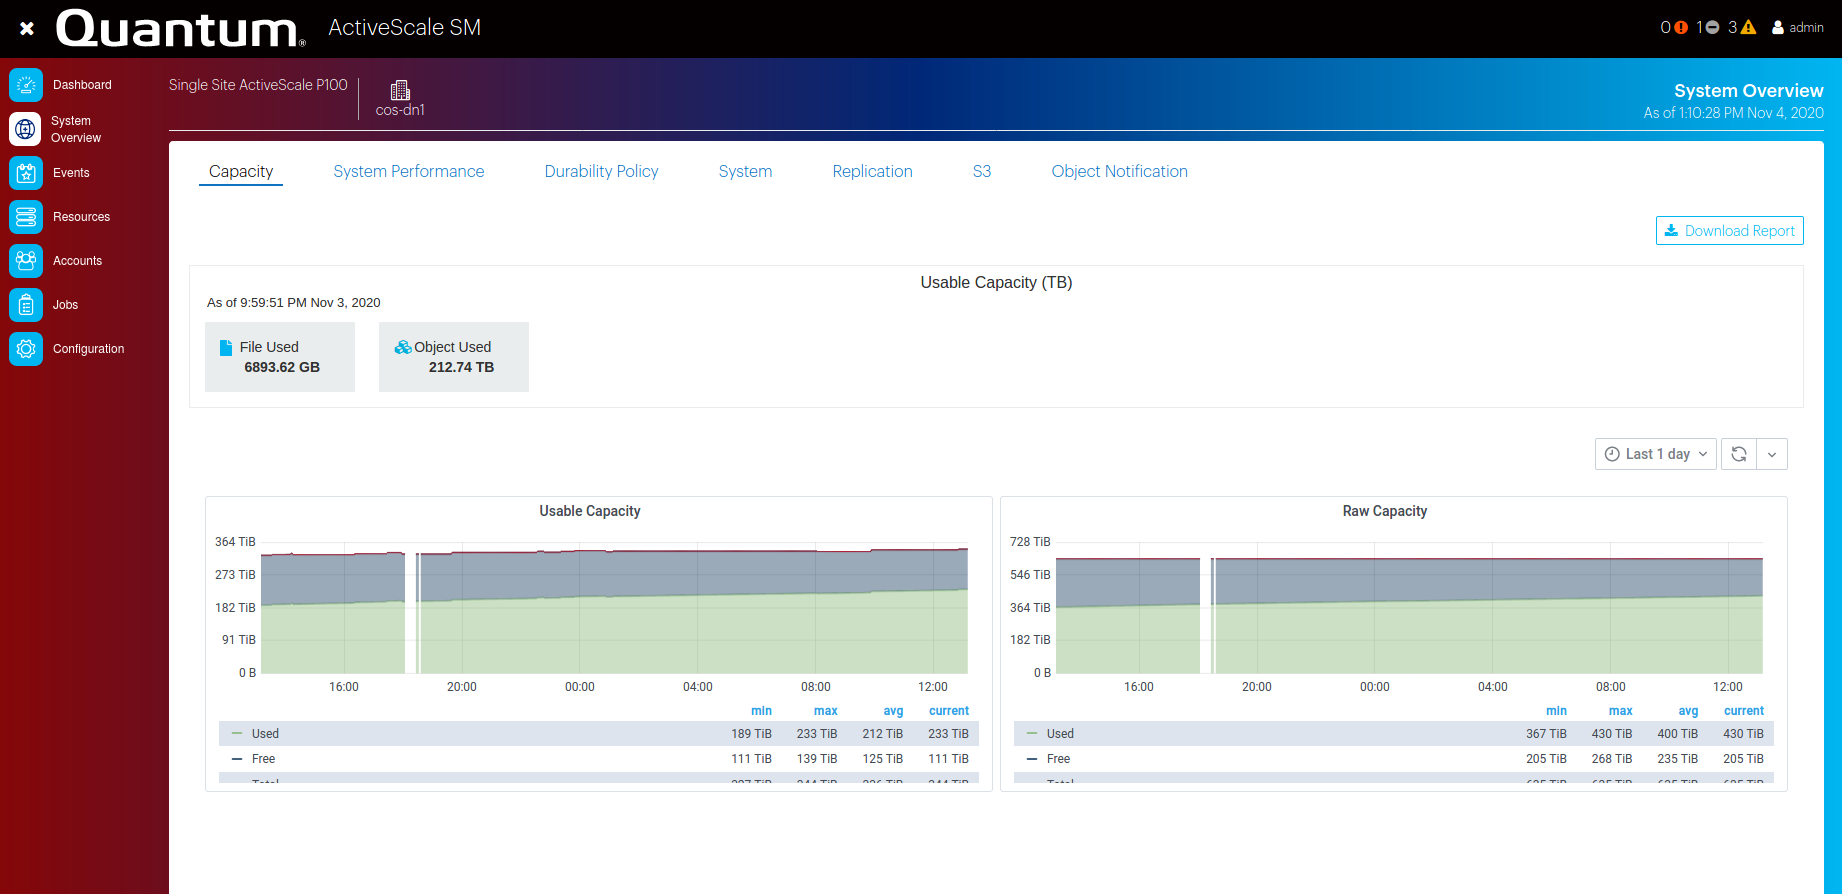
Click System Overview > Capacity.
ActiveScale SM displays a time series of capacity usage. If you have configured email notifications, the system notifies you when a potential capacity issue arises.
Figure 10: System Overview > Capacity

Note: By default, ‘Last 1 day’ is selected and only data from the last 24h is displayed. Choosing another time range is possible by clicking the button with the clock icon and either entering an absolute time range or choosing one of the standard relative time ranges in the drop down menu.
-
(Optional) Click Download Report.
Downloading a CSV version can also be done by performing the following:
-
Click on the panel title.
-
Select Inspect.
-
Select Data.
-
Using the Select result drop-down, pick a time series you want to download. Only one time series can be selected and downloaded at a time.
-
Click Download CSV.
Note: The download report option will download the data of the date range selected and displayed on the GUI.
ActiveScale SM displays various graphs representing various performance indicators. No action is needed. If you have configured email notifications, the system notifies you when a potential performance issue arises.
-
The Throughput | Read (MB/s) and Throughput | Write (MB/s) panels display S3 network traffic throughput on the system nodes and for all system nodes combined. The throughput is calculated based on network packet transmit and receive statistics for public and replication traffic combined. Throughput | Read (MB/s) is calculated from incoming S3 traffic. Throughput | Write (MB/s) is calculated from outgoing S3 traffic.
-
The Transactions | Read (ops) and Transactions | Write (ops) panels display S3 operations per second per system node and for all system nodes combined. Requests from public and internal clients are aggregated. Transactions | Read (ops) is calculated as the number of GET operations per second. Transactions | Write (ops) is calculated as the number of PUT operations per second.
-
The Response Time | Read (s) and Response Time | Write (s) panels display the average time for an S3 operation per system node and for all system nodes combined. Response times for requests coming from public and internal clients are aggregated. Response Time | Read (s) displays the average response time for GET requests. Response Time | Write (s) displays the average response time for PUT requests.
-
The Duration | Read (s) and Duration | Write (s) panels display the average duration for an S3 operation per system node and for all system nodes combined. Durations for requests coming from public and internal clients are aggregated. Duration | Read (s) displays the average duration for GET requests. Duration | Write (s) displays the average duration for PUT requests. Note that these durations also depend on the workload, because the size of the objects has a significant impact on the duration of the requests.
-
The Queue Size panel displays the number of public S3 requests that are currently queued
-
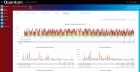
Click System Overview > System Performance.
Figure 11: System Overview > Performance: Objects

-
(Optional) Click Download Report.

Downloading a CSV version can also be done by performing the following:
-
Click on the panel title.
-
Select Inspect.
-
Select Data.
-
Using the Select result drop-down, pick a time series you want to download. Only one time series can be selected and downloaded at a time.
-
Click Download CSV.
Note: The download report option will download the data of the date range selected and displayed on the GUI.
ActiveScale SM displays various graphs representing various performance indicators. No action is needed. If you have configured email notifications, the system notifies you when a potential performance issue arises.
-
The Throughput | Read (MB/s) and Throughput | Write (MB/s) panels display public file network traffic throughput on the system nodes and for all system nodes combined. The throughput is calculated based on network packet transmit and receive statistics. Throughput | Read (MB/s) is calculated from public incoming file traffic. Throughput | Write (MB/s) is calculated from public outgoing file traffic.
-
The Transactions | Read (ops) and Transactions | Write (ops) panels display file operations per second per system node and for all system nodes combined. Transactions | Read (ops) is calculated as the number of file read operations per second. Transactions | Write (ops) is calculated as the number of file write operations per second.
-
The Response Time | Read (s) and Response Time | Write (s) panels display the average time for a file operation per system node and for all system nodes combined. Response Time | Read (s) displays the average response time for file read requests. Response Time | Write (s) displays the average response time for file write requests.
-
Click System Overview > System Performance.
Figure 12: System Overview> Files Performance

-
(Optional) Click Download Report.

Downloading a CSV version can also be done by performing the following:
-
Click on the panel title.
-
(Optional) Click Download Report.
-
Select Inspect.
-
Select Data.
-
Using the Select result drop-down, pick a time series you want to download. Only one time series can be selected and downloaded at a time.
-
Click Download CSV.
Note: The download report option will download the data of the date range selected and displayed on the GUI.