minute read
Library Management Console
You can view the Library Management Console (LMC) from the library’s touch screen.
-
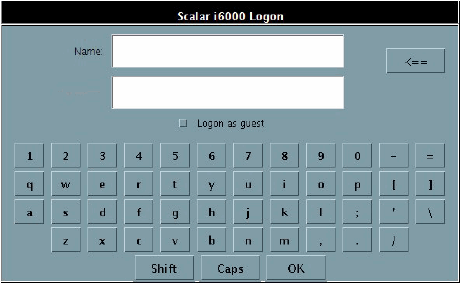
If the Scalar i6000 Logon dialog box is not already displayed on the library’s touch screen because the screen saver appears, tap the touch screen. The Scalar i6000 Logon dialog box appears.
-
In the Name text box, type the name of the user or administrator account with which you want to log on. If you want to log on with the default administrator account, type admin.
Additional Information
- While passwords are case-sensitive, user names are not case-sensitive. Select the Shift key to display uppercase letters and special characters. This enables you to type one uppercase letter or special character before the Scalar i6000 Logon dialog box returns to displaying lowercase characters. To type more than one uppercase character or special character, select the Caps key. The Caps key toggles between displaying uppercase and lowercase characters.
- Only one administrator at any given time can be logged on to the library.
- If you want to log on using the default administrator account (admin), and you do not remember the password, contact Quantum Support to reset the password.
- If the date and time have reset to January 1, 1970 or if the year is set to a date earlier than 1970, a warning dialog will display on login.
-
Position the cursor in the text box below the Name text box by tapping it, and then type the password for the user or administrator account.
If you are logging on to the library for the first time using the default administrator account (admin), type password. After you log on, the library prompts you to change the default admin password. You must enter and confirm a new password. Passwords that are most secure include a combination of letters, numbers, and non-alphanumeric characters. Passwords must be eight or more characters in length. The word “password” is not available for use.
- After you type a user name and password, select OK.
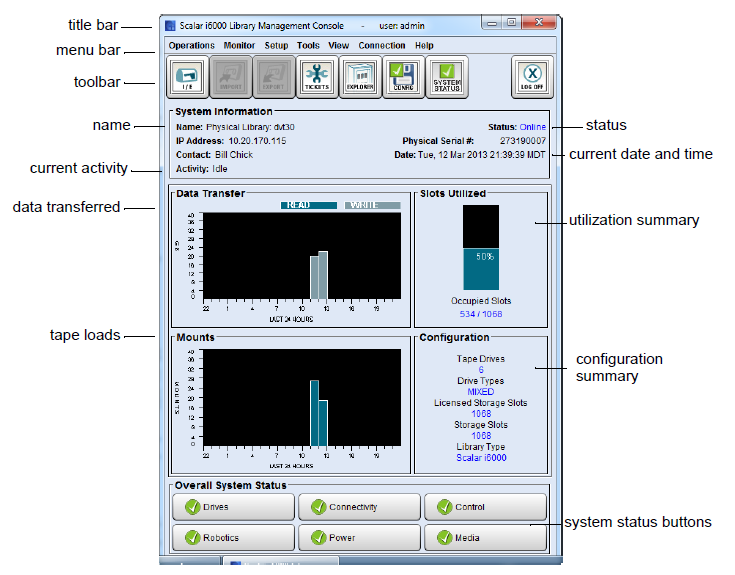
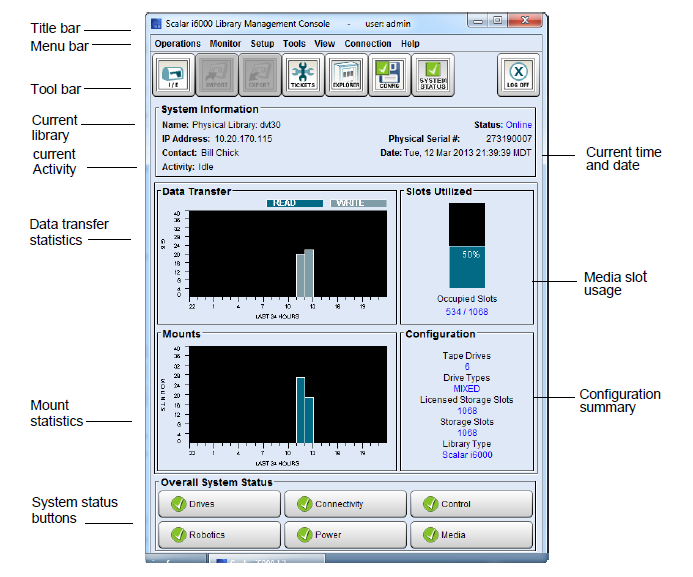
The main LMC display consists of five areas:
| Title Bar | The title bar on the touch screen view of the LMC displays the words Scalar i6000 Library Management Console. . |
| Menu Bar | The menu bar provides access to all menu commands used to manage library functions. |
| Toolbar | The toolbar displays icons that represent the most commonly run commands. |
| Library Information Panel | The library information panel fills most of the main LMC display, presenting operational data from the current library, whether physical or partition. |
| System Status | The system status buttons provide current status information for the six subsystems of the physical library. |
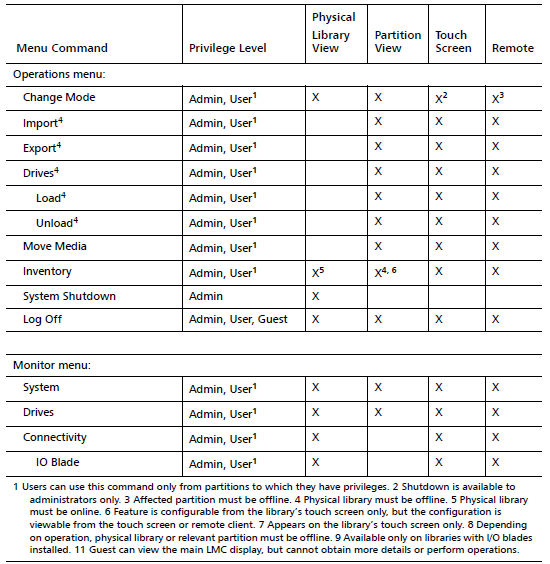
The following seven LMC menus organize commands into logical groupings:
| Operations | The Operations menu consists of commands, such as changing the library’s mode of operation, importing and exporting cartridges, loading and unloading drives, moving media, performing inventory, and logging off. |
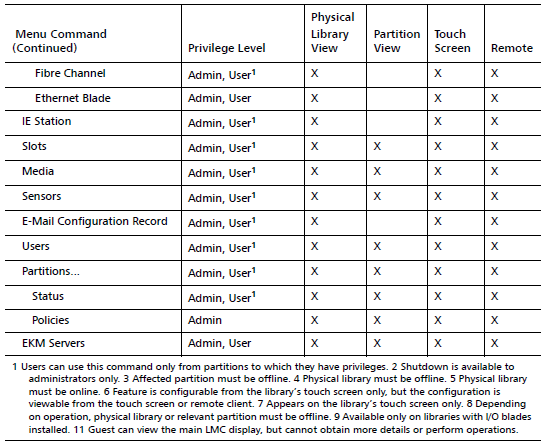
| Monitor | The Monitor menu consists of commands that you can use to obtain status information about various aspects of the library, including system, drives, connectivity, I/E stations, storage slots, media, sensors, and users. |
| Setup | The Setup menu consists of commands that you can use to set up and configure various aspects of the library, including partitions, devices, connectivity, network, physical library, users, notifications, date and time, licenses, e-mail, and SNMP trap registration. |
| Tools | The Tools menu consists of commands that you can use to maintain and troubleshoot the library. These tools enable you to work with RAS tickets, drives, and connectivity. They also enable you to capture snapshots, update software, teach the library, save and restore library configurations, run verification tests, and obtain drive resource utilization reports. |
| View | The View menu enables you to select the library (either the physical library or a partition) that you want currently displayed on the main LMC display. Some LMC menu commands require you to be in either a physical library or partition view to run them. |
| Connection | The Connection menu enables you to log on to multiple libraries and switch between consoles for different libraries without logging off. |
| Help | The Help menu provides you with access to Online Help as well as information about the library, such as copyright information, the product version, firmware version, and build information for various library components (LMC server, LMC client, MCB, CMB, and RCU). |
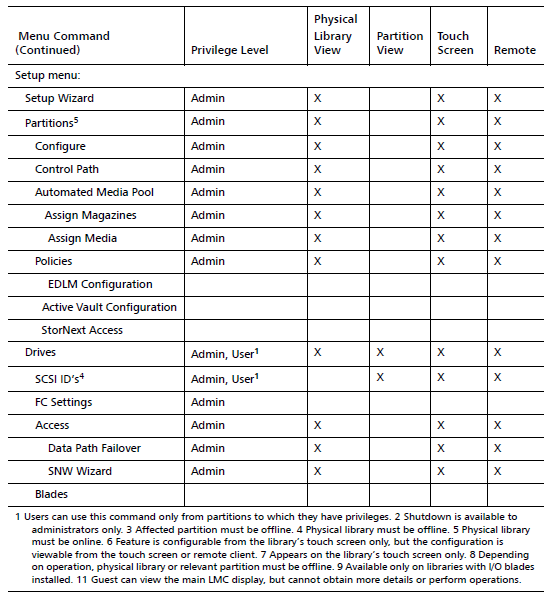
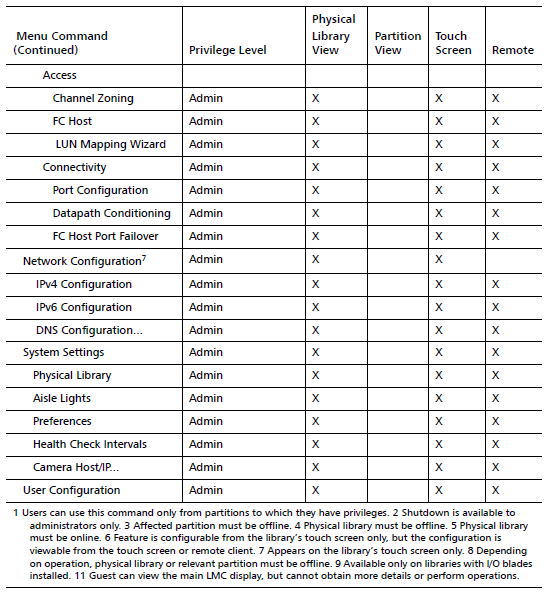
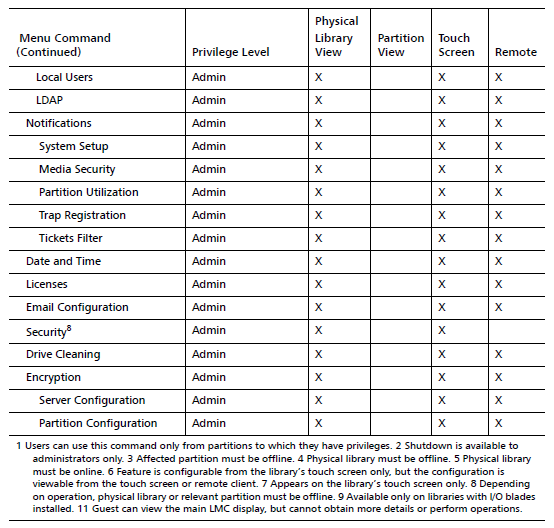
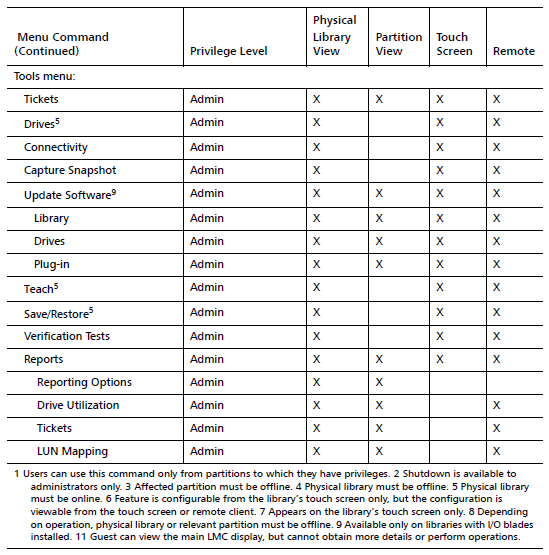
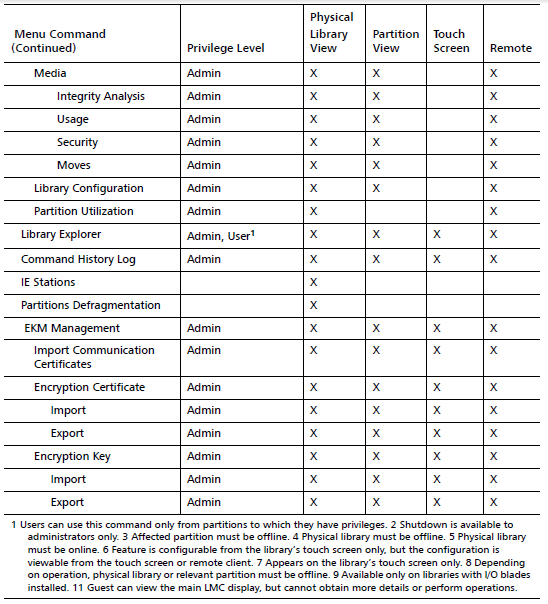
The tables below summarize all available menu commands, including required user privilege levels and required library environments (touch screen or remote client). The LMC prompts you to take the library offline or to select either the physical library or a partition if the command you request requires you to change library mode.
System status buttons are located at the bottom of the library information panel. If the touch screen remains unused after a period of time, the library screen saver appears. The color of the screen saver image reflects the status of the library as indicated by the system status buttons. For example, if system status buttons show a mix of green (Good), yellow (Warning or Degraded), and red (Failed) states, the color of the screen saver image will be red.
Note: The remote LMC has been turned off in systems running library firmware i13.2 and higher.
The toolbar consists of icons that represent commonly used commands that also are available on the menus.
| I/E | The I/E button displays a table of the current contents of the I/E station. You also can display the table by clicking Monitor > IE Station. |
| Import | The Import button launches the import of cartridges if the current library is a partition. You also can request an import operation by clicking Operations > Import. |
| Export | The Export button launches the export of cartridges if the current library is a partition. You also can request an export operation by clicking Operations > Export. |
| Tickets | The Tickets button displays tickets that the library created when it detected issues within its subsystems. You also can display tickets by clicking Tools > Tickets. |
| Explorer | The Explorer button provides a graphical presentation of all the drives, cartridges, and slots in the library. The Library Explorer can display all library elements according to physical location in any configuration, from one module to eight modules, and one drive up to the maximum number of 96 drives. |
| Config | The Config button indicates whether you have saved the current library configuration. |
| System Status | The System Status button displays a dialog box that has four (4) tabs: Components, Robots, Drives and, if installed, Towers. Each tab indicates the status of the elements and provides a graphical representation of the general status of each area. The button will display a green check mark if all system are online and running normally. It will display a red X if any of the components are offline or failing. |
| Log Off | The Log Off button logs off the current user after confirming the log off request. You also can log off by clicking Operations > Log Off. |
The library information panel occupies the central portion of the main LMC display. It provides you with a significant amount of dynamically updated status information.
The panel contains the following areas:
| Area | Description |
|---|---|
| Name | The name of the current library. This is the library that appears with a check mark beside it in the View menu. First, the genre of library appears, i.e. physical or partition. Then, after a colon, the name of the library appears. |
| IP Address | The IP address of the library. |
| Contact | The name of the customer contact identified in Setup > Notifications > System Setup. |
| Activity | The current activity for the current library. |
| Status | Online/offline status of the library/partition being viewed. |
| Physical Serial Number | Physical serial number of the library or partition being viewed. |
| Date | The current date and time. The date that appears reflects user settings, but the system operates according to Greenwich Mean Time (GMT). The displayed time reflects user settings, but the system operates on the GMT zone. |
| Data Transfer | The bar graph contrasts the amount of data read and written for the past 24 hours. The units being reported appear beside the graph. |
| Slots Utilized | This graph shows the percentage of occupied media slots in the library or partition, depending on the current view. The number of used media slots appears beneath the graph (occupied slots/total number of storage slots). |
| Mounts | The bar graph reports mount statistics compiled during the past 24 hours. The library updates this information every five minutes. |
| Configurations |
Configuration summary information is presented textually. Data points reported are:
Note: If the numbers shown are displayed in yellow or orange, then 80% of the available resources are used. If the numbers are displayed in red, then 90% of the available resources are used. |
System status buttons are located in the Overall System Status area at the bottom of the LMC.
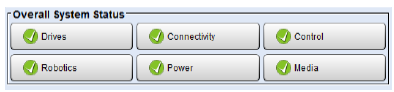
Each button represents a subsystem. The table below shows the library subsystems and some of the components that each subsystem represents. Each field replaceable unit (FRU) in the library belongs to one of the subsystems.
| Subsystem | Components |
|---|---|
| Drives | Drives, such as brick firmware, drive bricks, drive sleds _ |
| Robotics | Assemblies and processors involved in the movement and handling of library media, such as the IEX board, I/E stations, the pivot and reach assemblies, system barcode labels, doors, filters, the accessor, drive mounts, rails, towers, and carriages |
| Connectivity | Host connectivity components, such as I/O management units, I/O blades, and the chassis management blade (CMB) |
| Power | Power supplies and related hardware, such as the power distribution unit (PDU), power chassis, and fuses |
| Control | Main processor cards and related hardware and software, such as system firmware, the management control blade (MCB), the robotics control unit (RCU), the library motor drive (LMD), and the operator panel |
| Media | Media components such as cartridges and magazines |
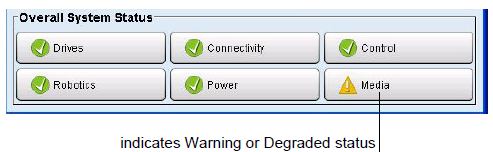
Each button displays a status indicator that reveals a Good, Warning, Degraded, or Failed state as follows:

|
Good (green) | The library system is in working order; no problems or issues exist. |

|
Warning or Degraded (yellow) | There is a degraded or failed component within this category that requires action, but the overall category still is functioning. |

|
Failed (flashing red) | A component in this category has failed. |
In the example below, the buttons shown indicate that all the Drives, Connectivity, Control, Robotics, and Power subsystems are functioning normally (Good), while issues exist in the Media subsystem.
You can click system status buttons to display additional information about the subsystems. The information that appears depends on the status shown on the button:
| Good | Either a message appears informing you that no tickets exist for the subsystem or a list of subsystem tickets appears that are in Closed or Verified states. Tickets provide information about issues that the library has detected. |
| Warning, Degraded, or Failed | A list of open tickets for the subsystem appears. Tickets provide information about issues that the library has detected. |
- Select Operations > Log Off or select the Log Off button on the toolbar. A message appears that asks you whether you are sure that you want to log off.
- Select Yes. The Scalar i6000 Logon dialog box appears.