Metrics Exporter
Use the DXi Metrics Exporter to enable the export of all DXi Advanced Reporting metrics, like CPU, memory usage, network activity, data reduction, etc., in Prometheus data format. You can enable the function using either the DXi GUI or by using DXi Command Line Interface (CLI) commands. This data can be viewed and read using analytic programs that can accept Prometheus data format.
To enable metrics export using CLI commands, see DXi Command Line Interface (CLI).
Customizing and creating the export file from your DXi system begins with clicking on the Configuration menu, then the System > Metrics Exporter tab, to reach the Metrics Exporter screen.
In addition to the GUI-based process in this topic, the following references should help you understand and maximize your use of the Metrics Exporter:
-
To see all of the information that can be exported to show your system's health, resources, and status, see the DXi Advanced Reporting Documentation Center.
-
For details on how Prometheus and Grafana work together to export and display your metric information, see https://grafana.com/docs/grafana/latest/getting-started/get-started-grafana-prometheus/.
Note: Metrics Exporter is disabled by default.
To access and enable Metrics Exporter:
-
From your DXi home page, select Configuration > System > Security > Metrics Exporter.
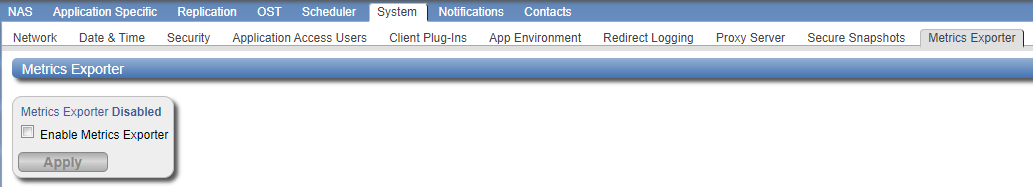
The Metrics Exporter page displays.
-
Under Metrics Exporter, you can either:
- Select the Enable Metrics Exporter check box to enable the feature.
- Clear the Enable Metrics Exporter check box to stop data export and disable the feature.
-
Click Apply to confirm enabling or disabling the feature.
Note: When enabled, the Metrics Exporter opens firewall port 8090 to make the data available. This database is updated every minute.
-
To see your point-in-time-generated Prometheus data file:
-
Open a browser and type 10.20.162.48:8090/metrics in the address box.
-
Press Enter.
-
-
To view and read the metrics visually, you need a display application like Grafana.