Working with Advanced Reporting Time Ranges
Use the Timeline bar, Time Range bar, or Dynamic Zoom feature in Advanced Reporting to select the time range for which data is displayed. By default, Advanced Reporting displays data for the most recent 7 days of logging.
Viewing Tips
Review the following tips to understand how time-range changes affect your view.
When you change the time range, Advanced Reporting automatically adjusts the resolution of performance data.
- The resolution is finer — more granular — for shorter time ranges.
- The resolution is coarser — less granular — for longer time ranges.
When you apply a preset time range, Advanced Reporting resizes the time range while maintaining the center of the time range.
Example
If you are currently viewing a one-week time range that goes from Sunday to Saturday, applying the 1d preset displays data for Wednesday, which is at the center of the weekly range.
Regardless of the time range being graphed, Advanced Reporting scales all logged data to use the entire width of each graph.
Use the Time Range bar in the top menu to select the numeric base for the data on which to report, adjust the start and end times of the time range, assign a preset time range, or adjust the time range forward or backward in time.
Figure 1: Top Menu with Time Range Bar

|
1 – Backward (far left side) and Forward (far right side) Navigation Buttons |
4 – Preset Zoom Range Buttons |
7 – Base Drop-Down List |
|
2 – Start and End Time Adjustment Fields |
5 – Reset Timerange Button |
8 – Reload Button |
|
3 – Preset Time Range Buttons |
6 – Time Zone Selector |
|
- Display the report for which to view data.
- In the Base drop-down list, select the numeric base for the data on which to report:
 1000 Bytes/KBs
Tape drives, tape cartridges, and disk drives report capacities in units of 1000 bytes per kilobyte.
 1024 Bytes/KBs
Backup applications typically report summaries in units of 1024 bytes per kilobyte.
- Adjust the time range by doing any of the following:
 Adjust start and end times
- In the Start and End fields, enter a starting and ending date and time to define the time range to display.
- Click reload to redisplay the graphs with the new time range.
 Assign a preset time range
Click any of the following Preset Time Range buttons to quickly display data for a different time range:
- 1h – 1 hour
- 4h – 4 hours
- 12h – 12 hours
- 1d – 1 day
- 1w – 1 week
- 1m – 1 month
- 1y – 1 year
 Assign a preset zoom factor
Click any of the following to zoom in or out on the graphs by a fixed factor:
- x0.25 – Zooms in by a quarter of the currently displayed time range.
- x0.5 – Zooms in by half of the currently displayed time range.
- x2.0 – Zooms out by 2 times the currently displayed time range.
- x4.0 – Zooms out by 4 times the currently displayed time range.
 Adjust the time range forward or backward
Click the Backward or Forward Navigation buttons to move the time range by any of the following amounts:
- <<< or >>> Moves the time range backward or forward an amount equal to the current time range.
- << or >> Moves the time range backward or forward an amount equal to one half of the current time range.
- < or > Moves the time range backward or forward an amount equal to one quarter of the current time range.
 Adjust the Time Range
Display the report for which to view data.
 Assign a preset time range
- Click any of the preset time ranges located at the top of the Timeline bar.
- Double-click the Time Line to apply the preset range.
 Move the time range forward or backward in time
- Drag the Time Line backward or forward.
- Double-click the Time Line to apply the new range.
 Shrink or expand the time range
- Drag the Right Handle and Left Handle to the desired time range.
- Double-click the Time Line to apply the new range.
Click reset timerange on the Time Range bar to adjust the time range to display the most recent seven days of logging.
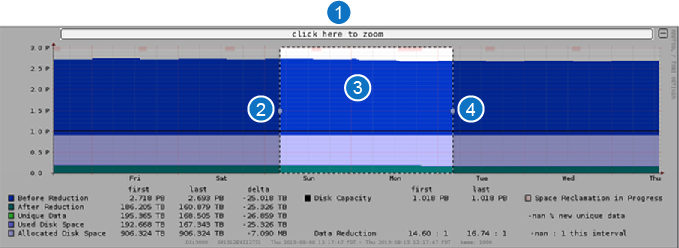
Use the Dynamic Zoom feature to select a part of the graph on which to see more detail.
Figure 2: Dynamic Zoom Feature

|
1 – Click to Zoom Bar |
2 – Left Handle |
3 – Zoom Area |
4 – Right Handle |
- Display the report for which to view data.
- Click on the spot of the graph on which to zoom to display selection handles.
-
Note: The graph title changes to read click here to zoom and a narrow vertical section appears highlighted with left and right handles, as shown above.
- Drag the Left Handle and Right Handle to adjust the area of the graph on which to zoom.
- Click anywhere in the click-to-zoom bar to zoom to the selected range.
