Advanced Reporting Graph Features
In Advanced Reporting, each report is made up of one or more graphs. Each graph displays a specific type of performance data for the selected time range, as applicable, such as the Data Volume Overview, Reduction Ratio,
Although each graph in Advanced Reporting displays a specific type of performance data, many components are shared between graphs. Review the following to gain a better understanding of graph components — both shared and unique.
The horizontal axis of each graph represents time, and displays the selected time range.
The vertical axis can vary between graphs. Often the vertical axis represents capacity or data amount, or a calculated value such as ratio, average, or percentage.
Each graph contains a color-coded legend. Use the legend to help in reading and interpreting the data displayed on the graph.
For some graphs, the legend contains first, last, and delta values for variables within the graph.
|
Values |
Descriptions |
|---|---|
|
first |
The value of the variable at the start of the time range. |
|
last |
The value of the variable at the end of the time range. |
|
delta |
The difference between the first and last values over the time range. Equation: last - first = delta |
Note: If a graph displays a value as nan — not a number — Advanced Reporting could not calculate the value.
A white gap in a graph indicates an absence of data logging for a period of time. This absence can occur for the following reasons:
- A system reboot occurred.
- The system was busy.
- Logging was turned off.
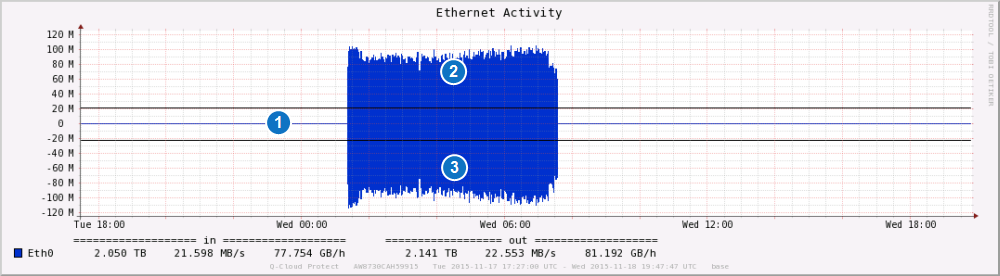
Graphs include a zero line to show when data is being written to or read from the
- Positive values — above the zero line — represent data being written to the appliance.
- Negative values — below the zero line — represent data being read from the appliance.
Figure 1: Zero Line Example
|
1 – Zero Line |
|
2 – Data written to the appliance |
|
3 – Data read from the appliance |
A single graph can display multiple variables, allowing you to view the interaction between them. Advanced Reporting uses two methods for placing multiple variables on the same graph.
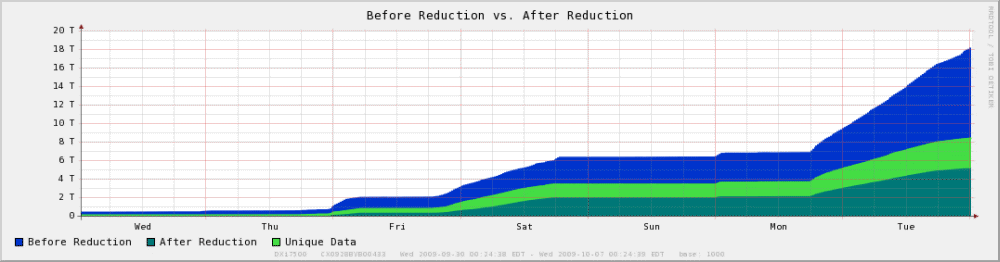
Layered graphs compare related variables by superimposing data for two or more variables. Each variable is assigned a different color so you can easily distinguish between the variables.
Example
The Before Reduction vs. After Reduction graph depicts the data for the Before Reduction, After Reduction, and Unique Data variables using different colors. Layering these related variables lets you easily compare the amount of each type of data stored on the appliance.
Figure 2: Layered Graph Example
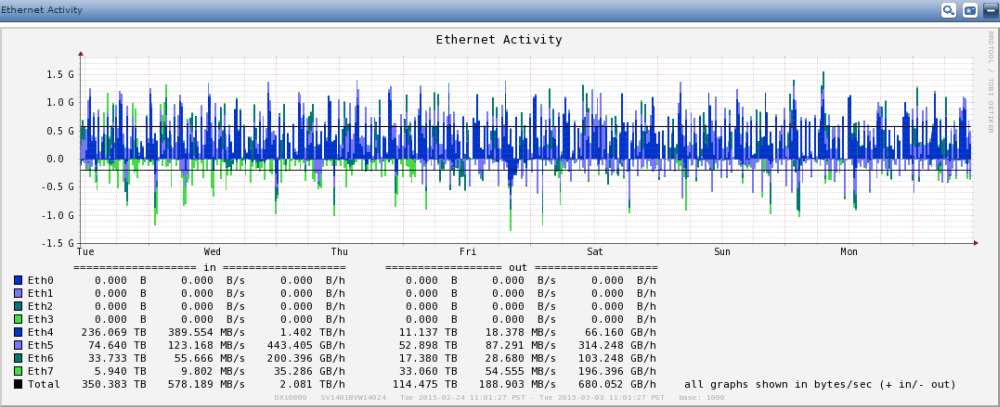
Stacked graphs display aggregate performance by adding the values for two or more variables to arrive at a total value. Each variable is assigned a different color so you can easily distinguish between the variables.
Example
The Ethernet Activity graph adds the values for each Ethernet port to reach a total value for each point in the time range. Each of the ports is assigned a different color so you can see the contribution it makes to the total value.
Figure 3: Stacked Graph Example
The following additional features are shared among all graphs:
| Feature | Description |
|---|---|
| Drag and Drop | To change the order of the graphs within a report, drag a graph by its title bar and move it above or below another graph. |
| Minimize/ Maximize |
The default state of all graphs is maximized. When you hover into a graph, the Minimize icon Note: when you minimize a graph, the Minimize icon changes to the Maximize icon To restore the graph to its full size, click the Maximize icon. |
| Export | To export a JPG or PNG image of the graph, click  . . |
| Show/Hide | To display or hide a graph's title and legend, click  . . |
 appear in the top-right corner of the graph title bar. Click to minimize the graph to the vertical height of the graph's title.
 .
.Note: Graphs are restored to their default appearance the next time you log on to Advanced Reporting.