Combined – Delta in Bytes/H and Bytes/S Graphs
The Combined – delta in Bytes/h and Combined – delta in Bytes/s graphs display changes for Before Reduction, Unique Data, and After Reduction variables in bytes per hour or bytes per second. Use these graphs to see increases and decreases in total amounts of data stored on the
Figure 1: Combined – delta in Bytes/h Graph
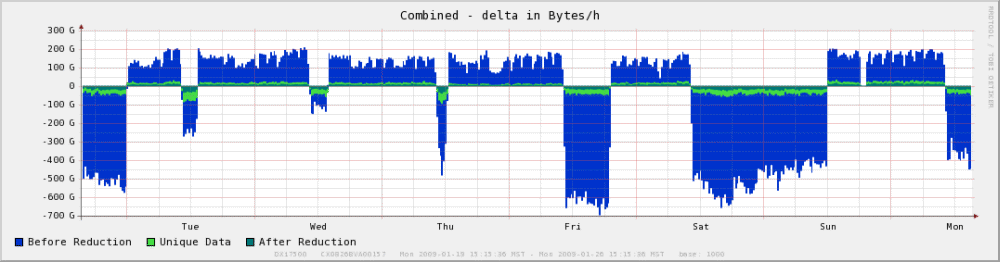
Displays values in relation to the zero line as follows:
- Values above the zero line indicate an increase in stored data.
- Values below the zero line indicate a decrease in stored data.
Displays increases and decreases in the amount of ingested — not deduplicated, nor compressed — data stored on the appliance.
Displays increases and decreases in the amount of deduplicated data stored on the appliance.
Displays increases and decreases in the amount of deduplicated, compressed data stored on the appliance.