CPU Stats in % Graph
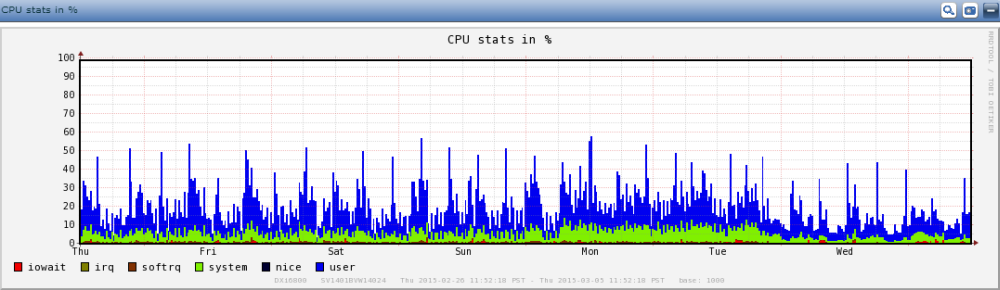
The CPU stats in % graph displays the relative CPU usage for the following seven process categories. Use this graph to see how CPU resources are allocated among these categories.
Figure 1: CPU stats in % Graph
The following table lists the process categories displayed on the CPU stats in % graph:
|
Process Category |
Description |
|---|---|
|
iowait (red) |
The CPU is waiting for an I/O appliance, such as a disk, to respond. |
|
irq (gold) |
The CPU is handling an interrupt request related to I/O, such as network, disk, keyboard, or serial port activity. |
|
softrq (brown) |
The CPU is handling a high-level I/O task, such as timer interrupts or packets in the TCP/IP stack. |
|
system (green) |
The CPU is handling a kernel process, such as filesystem operations related to the StorNext or blocklet filesystems. |
|
nice (black) |
The CPU is handling processes that have lower priority, such as background processes. |
|
user (blue) |
The CPU is handling processes that are not owned by the kernel, such as deduplication, space management, and replication activities. |
|
idle (not shown) |
The CPU is not handling any of the other process categories. |
Consideration
When viewing statistics for the process categories in the CPU stats in % graph, keep in mind that the amount of CPU activity consumed by each process category is expressed as a percentage. The percentages include the value for idle, which is not shown in the graph, and add up to 100%.