Monitor and Manage
This section details the tasks that will help you monitor and manage the VS4160-HCI.
Using the Manage VM Menu, you can create, run, remove, and move a virtual machine (VM) as needed. You can also monitor a VM's status.
Note: Use the Manage VM Menu to perform any VM functions. Do not use the Virtual Machine Manager application, except to mount USB media. See Download Data Collect Logs to a USB Drive.
If Node 1 fails or is rebooting, its VM automatically fails over to Node 2. However, after Node 1 is online again, you must manually move the VM from Node 2 to Node 1.
The VM Status window automatically displays when you connect to the Host OS console, even if a VM does not exist. If needed, you can open the window by double-clicking VM-Status on the desktop.
![]()
Possible VM statuses are:
- Running
- Paused
- Shut Off
If Node 1 has a VM, it will start automatically after the clustering process is complete, unless it was manually stopped through the Manage VM menu. In that case, you must manually start the VM.
If you reboot a node, an existing VM will not display in the VM Status window until the node exits Standby or Maintenance mode. See Node Operations, Option 6) Node Operations Menu.
Also, if you stop a VM before rebooting a node, the VM will not display in the VM Status window until you start it again.
With the Manage VM Menu, you can perform the following VM functions on a node:
Create and add a VM to a node: You can create a VM to support failover and failback between nodes.
Note: You cannot add a VM to Node 2 if you intend to cluster the node.
- Remove a VM from a node: You must remove the VM from Node 2 before adding Node 2 to a cluster.
- Start a VM: Unless you stopped the VM using the Stop a VM function in the menu, the VM starts automatically when you boot up its node. If you shut down the VM by using the Stop a VM function, you must manually restart it with the Start a VM function.
- Stop a VM: Use this function to stop the VM from automatically starting when you boot up its node.
- Force a failover or a failback of a VM: The VM that supports failover can be moved to another, clustered node, if its original node fails. You can also return (failback) that VM to its original node.
-
In the Host OS console, double-click VS-Settings.

The VS-Settings Menu appears.

-
Type 1 in the VS-Settings Menu; then press Enter. The Manage VMs Menu appears.

-
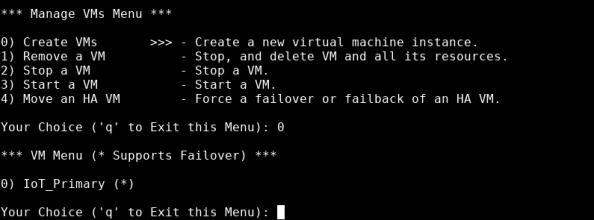
In the Manage VMs Menu, type 0, then press Enter.
-
Enter the number that corresponds to the VM that you want to create, then press Enter. An asterisk (*) indicates that the VM supports failover.
The system informed you of its progress. When the process is complete, "Successfully created VM" displays
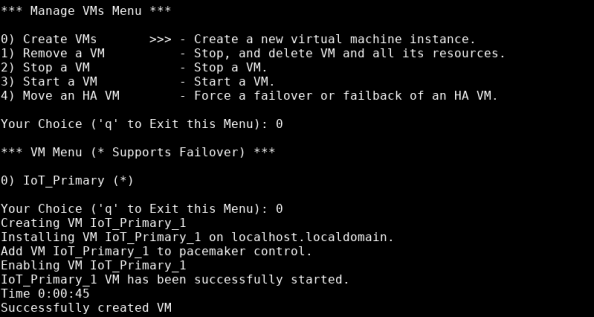
The status of the new VM displays in the VM Status window. For more information about a VM's status, see Monitor a VM.
-
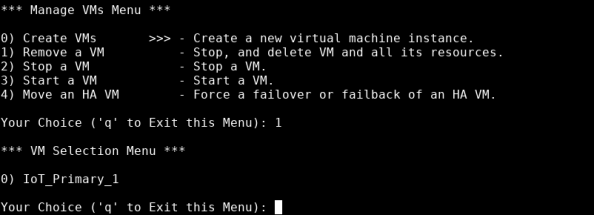
In the Manage VMs Menu, type 1, then press Enter.
-
Enter the number that corresponds to the VM that you want to remove, then press Enter.
-
The system notifies you of potential data loss, and asks you to confirm that you want to remove the indicated VM. Type y, then press Enter.
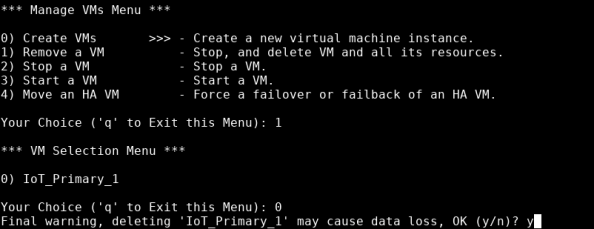
The system indicates how long it takes to remove the VM, then informs you that the VM is removed.
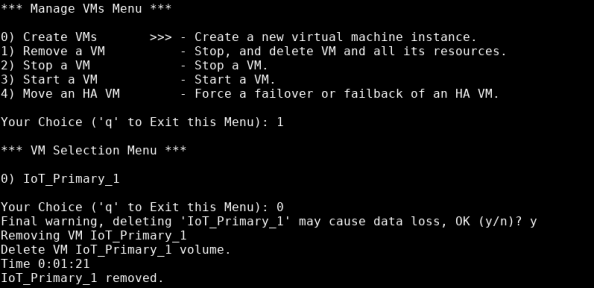
If you stop a VM, you must manually restart it.
- In the Manage VMs Menu, type 2, then press Enter.
-
Type the number that represents the VM that you want to stop, then press Enter.
The system monitors the length of time it takes to stop the VM, then informs you the VM stopped. At that point, the Manage VMs Menu displays.
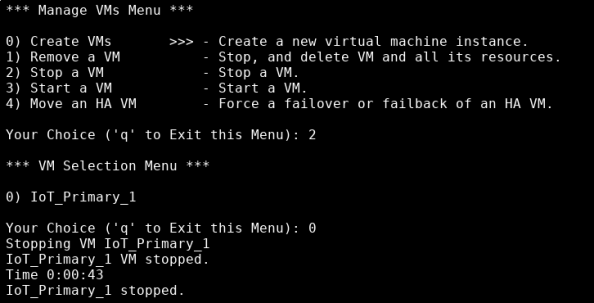
VMs start automatically, unless they were manually stopped.
- In the Manage VMs Menu, type 3, then press Enter.
-
Type the number that represents the VM that you want to start, then press Enter.
The system monitors the length of time it takes to start the VM, then informs you the VM started. At that point, the Manage VMs Menu displays.
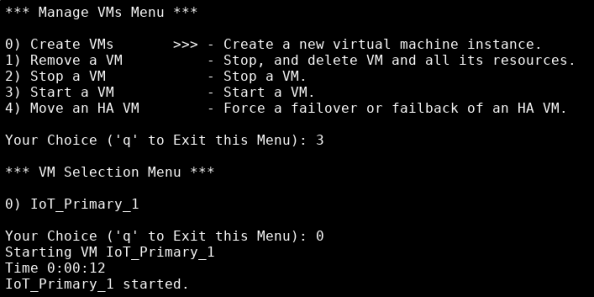
Use this option to failover or failback a VM. The VM on Node 1 will automatically failover to Node 2 if the node stops running or is rebooting. However, you must manually move the VM back (failback) from Node 2 to Node 1.
- In the Manage VMs Menu, type 4, then press Enter.
- Type the number that represents the VM that you want to failover or failback; then press Enter.
- Type the node number to which you want to failover or failback the VM, then press Enter.
-
The system will inform you when the VM is successfully moved to another node.
If the VM did not move successfully, see Contacting Quantum.
After you cluster multiple VS4160-HCI nodes together, you can monitor the state of the cluster through the VS-Cluster icon and the Clustering Menu. Both options display the same information.
Clustering multiple nodes together provides high availability for the primary VM. If Node 1 fails or is rebooting, the VM automatically fails over to Node 2.
For more information about clustering nodes, see Clustering a Multi-Node Configuration.
After you create a cluster, the VS-Cluster icon displays.
| Color | Description |
|---|---|

|
Green indicates that the cluster's status is healthy, and there are no issues. |
|
|
This can occur during initial cluster configuration, when the data volumes are synchronizing between the nodes. This can also occur if one of the nodes has been put into a Standby state. |
Click VS-Cluster to view the cluster's status in a terminal window.
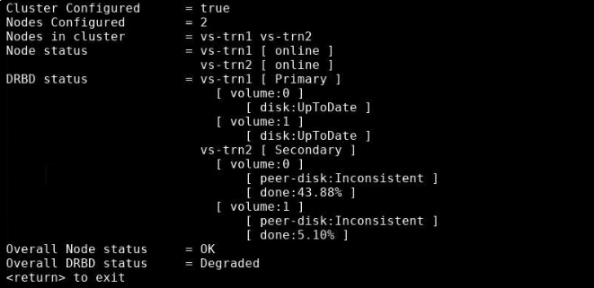
- Launch the Host OS Console.
-
Double-click VS-Settings to open the VS-Settings Menu.

-
Type 2 to open the Clustering Menu, then press Enter.

-
In the Clustering Menu, type 4 to view the status of the cluster; then press Enter.

The cluster's status displays in a terminal window.

The Host Operating System (OS) provides a simple way to initiate the script that gathers the data collect logs, creates a .zip file of the contents, and provides a folder location for the .zip file. This file contains the diagnostic logs for all of the system components, including:
- Host Operating System (OS)
- Windows VM log files
- Metasys log files
- System hardware
- Network
You can create the .zip file that contains the diagnostic logs for all of the system components through the VS-Collect icon, or the VS-Settings Menu. Both methods run the same script, and provide the same output.
First, you must log in and Launch the Host OS Console.
-
In the Host OS Console, double-click VS-Collect.

Note: Hover your mouse over the VS-Collect icon for a quick description of its function.
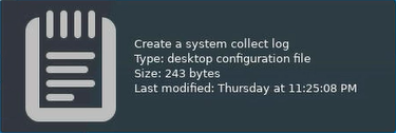
The system starts creating the file.
-
The system notifies you when it is done collecting data, and where you can find the resulting .zip file. In the example below, the system placed the file collect-S264148X8C23790-2019-09-23-14-14-22.zip in the following location: /scratch/collect/.

-
To retrieve this file from the server, transfer it over the network from the Host OS server to your laptop, or a USB drive. See Download Data Collect Logs for more information.
-
In the Host OS Console, double-click VS-Settings.

The VS-Settings Menu opens in a terminal window.

-
Type 4 and press Enter to open the Service Tasks Menu.

-
Type 0 and press Enter to start collecting data.
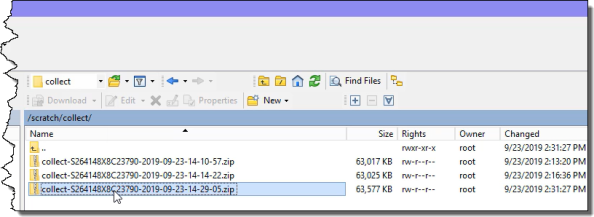
The system notifies you when it is done collecting data, and where you can find the resulting .zip file. In the example below, the system placed the file collect-S264148X8C23790-2019-09-23-14-29-05.zip in the following location: /scratch/collect.
Note: The following path and file names are examples.

-
To retrieve this file from the server, transfer it over the network from the Host OS server to your laptop or a USB drive. See Download Data Collect Logs for more information.
You can use the system to Generate Data Collect Logs to help diagnose an issue. After you download the .zip file to a laptop through a session control protocol (SCP) client or to a USB drive, see Contacting Quantum for assistance in transferring the file to Quantum for analysis and issue resolution.
To download a data collect log file to the laptop through SCP:
- Open an SCP client, such as WinSCP client.
-
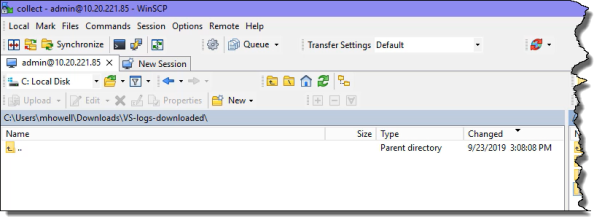
In the left pane, navigate to the location on your laptop where you want to download the data collect .zip file.
-
In the right pane, navigate to the folder that contains the .zip file that you want to download to your laptop.
-
Drag the file that you want to download from the directory in the right pane to the laptop's directory in the left pane.
A dialog box informs you of the download's progress.
To download the data collect log file to a USB drive:
- Log in, and Launch the Host OS Console.
-
In the Host OS Console, double-click on the VS-Settings icon.

-
Type 4 and press Enter to open the Service Tasks Menu.

-
Type 1 and press Enter. A list of .zip files display.

- Type the number that corresponds with the .zip file that you want to download, then press Enter.
-
Insert a USB drive into the VS4160-HCI. Quantum recommends using the USB port on the front panel of the VS4160-HCI. The system lists the USB drives that it found.

-
Type the number that corresponds with the USB drive to which you want to download the .zip file, then press Enter. The system notifies you when it copied the .zip file to the USB drive.

-
The system notifies you when you can remove the USB drive; after you remove it, press Enter.

- The Service Tasks Menu displays; type q, then press Enter to return to the VS-Settings Menu.
- In the VS-Settings Menu, type q, then press Enter to close the menu.
The VS-Settings Menu opens in a terminal emulation window.

The system generates two kinds of RAS tickets: notes and alerts.
- The VS-Ticket icon in the Host OS console indicates if there is a RAS ticket by turning yellow or red, and it provides access to the tickets.
- After you view the tickets, the VS-Tickets icon turns white.
- After you view a ticket, you can delete it, or keep it to review later.
-
You can also create a new ticket.
Color Ticket Type Description 
VS-Tickets Icon White indicates that there are no notes or alerts, or that existing notes were read. 
VS-Tickets Icon: Notes
Yellow indicates that the system has unread notes. When a system completes its first bootup, it generates the following note:
SUCCESS: baseos.sh, firstboot completed.

VS-Tickets Icon: Alerts
Red indicates that the system has unread alerts. Some example alerts include:
- Cluster Network Port [name] is DOWN!
- Cluster Network Port [name] is UP!
- Cluster status changed to Warning.
- Launch the Host OS console.
-
Double-click VS-Tickets. The Ticket window appears, listing current tickets.
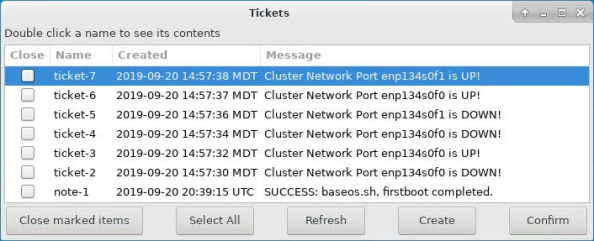
- If needed, click Refresh to view any tickets that were created while the Ticket window is open.
- Double-click a ticket to view any additional details.
-
At this point, you can keep a ticket to review it later, or you can delete it.
- To delete a ticket, select its check box, then click Close marked items.
- To keep a ticket, click Confirm to close the window.
- Launch the Host OS Console.
-
Double-click VS-Tickets. The Ticket window appears, listing current tickets.

-
Click Create to open the window in which you can enter a ticket (alert) or a note.

-
After you finish entering the text for the alert or note, click Create ticket to categorize the ticket as an alert, or click Create note to categorize the ticket as a note.
The window closes, and the VS-Tickets icon turns red or yellow, depending upon whether you created an alert or a note.
The drive physical numbering scheme in a 60-drive system is 0-59 within the chassis. Refer to the image below.
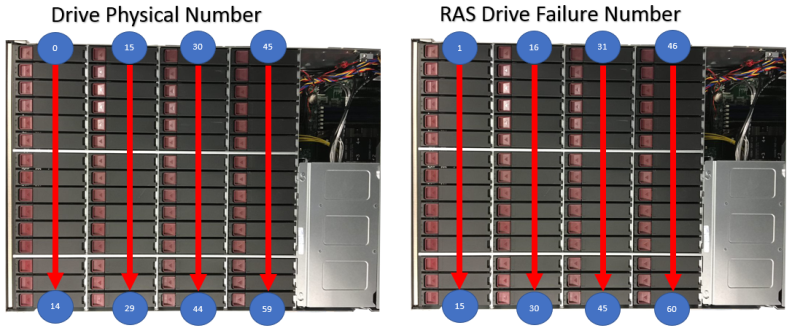
The RAS drive numbering scheme is 1-60 for any drive failures within the chassis. The RAS ticket will identify drives as 1-60. Refer to the following table for drive physical numbering scheme versus RAS drive numbering scheme.
| Drive Physical Numbering | RAS Drive Failure Numbering |
|---|---|
| 0 | 1 |
| 1 | 2 |
| 2 | 3 |
| 3 | 4 |
| 4 | 5 |
| 5 | 6 |
| 6 | 7 |
| 7 | 8 |
| 8 | 9 |
| 9 | 10 |
| 10 | 11 |
| 11-59 | 12-60 |
The drive physical numbering scheme in a 36-drive system is 0-35 within the chassis. Refer to the image below.
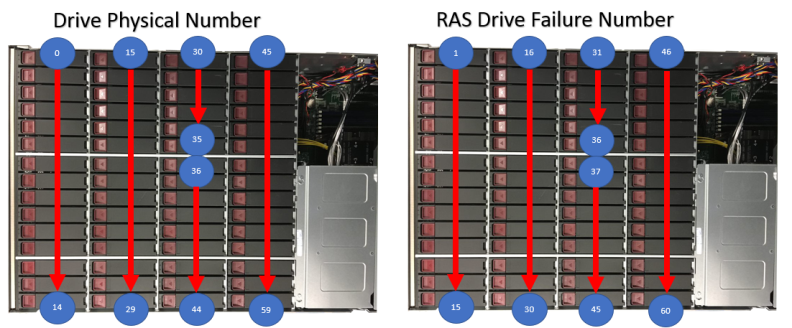
| Drive Physical Number | RAS Drive Failure Number |
|---|---|
| Drive blanks installed in slots: 45-59 | Drive blanks installed in slots: 46-60 |
| Drive blanks installed in slots: 36-44 | Drive blanks installed in slots: 37-45 |
| Drives installed in slots: 30-35 | Drives installed in slots: 31-36 |
| Drives installed in slots: 15-29 | Drives installed in slots: 16-30 |
| Drives installed in slots: 0-14 | Drives installed in slots: 1-15 |
The RAS drive numbering scheme is 1-36 for any drive failures within the chassis. The RAS ticket will identify drives as 1-36. Refer to the following table for drive physical numbering scheme versus RAS drive failure numbering scheme.
| Drive Physical Numbering | RAS Drive Failure Numbering |
|---|---|
| 0 | 1 |
| 1 | 2 |
| 2 | 3 |
| 3 | 4 |
| 4 | 5 |
| 5 | 6 |
| 6 | 7 |
| 7 | 8 |
| 8 | 9 |
| 9 | 10 |
| 10 | 11 |
| 11-35 | 12-36 |
