minute read
The F-Series UI Overview
The Quantum F2200 includes the F-Series UI, which allows for monitoring and re-configuring the system after initial configuration.
|
The F-Series UI is a web-based user interface (UI) which is used to view system status and change configuration settings. |
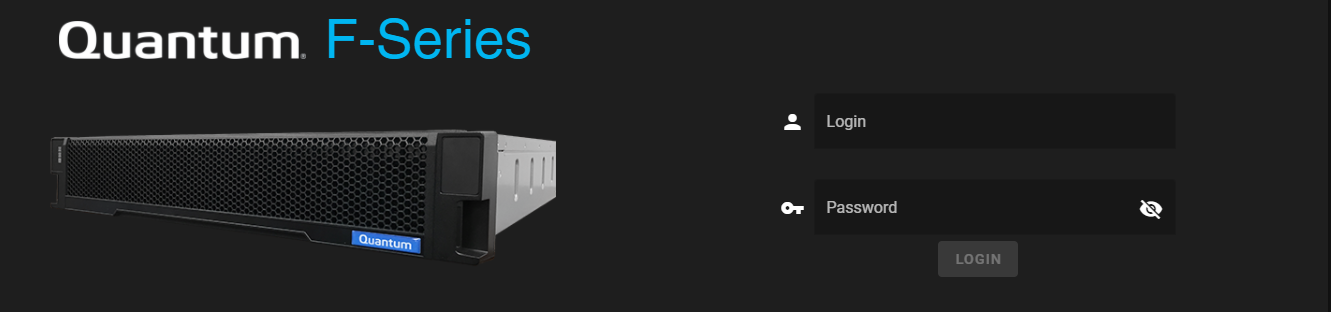
- Access the F-Series UI log in page uisng one of the management IP addresses assigned to the F2200 during initial system configuration on the log in screen:
- Enter
adminfor the Login user, and the Password you assigned during initial system configuration. - Click LOGIN.
Note: Currently, there is only one user account for the system,
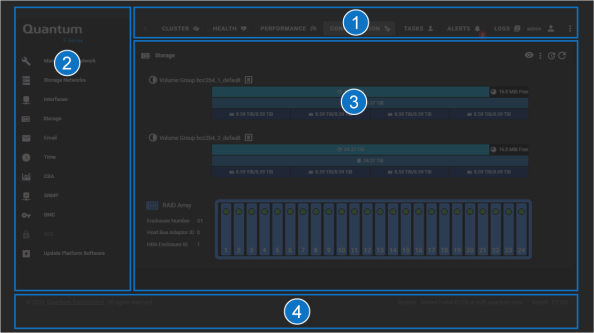
The F-Series UI includes the following key areas:
| Item | Description |
|---|---|
| 1 |
Top navigation items/header. See Top navigation items |
| 2 |
Left navigation areas: |
| 3 | Main content area (content differs depending on option selected – Configuration > Storage page shown above) |
| 4 | Footer area. See F-Series UI footer information. |
| Item | Description |
|---|---|
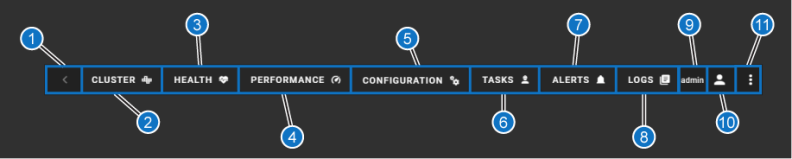
| 1 | Expand/Collapse left navigation button |
| 2 | CLUSTER – provides a view of both controllers, and graphs displaying metrics for a few key system performance indicators (default view when you first login to the system; view shown when you click the Quantum F-Series logo in the left navigation). |
| 3 |
HEALTH – this provides access to various health pages. |
| 4 |
PERFORMANCE – provides access to various pages of performance graphs. |
| 5 |
CONFIGURATION – provides access to configuring various system components. |
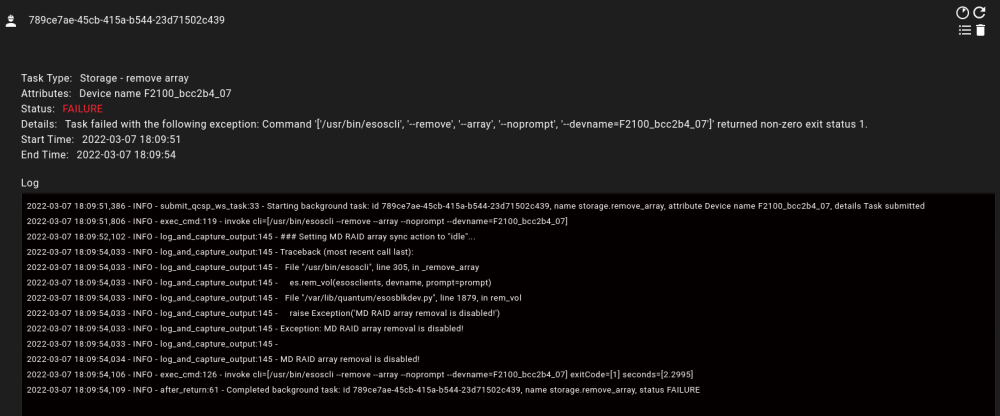
| 6 | TASKS – provides a list of all the active and previous tasks the system has initiated, and status for each. If you click on a task, you will see comprehensive detail and log information about the task. |
| 7 |
ALERTS – provides a list of all the active alerts on the system. If you use the arrow on the left-hand side of each alert, you can see additional detail about the alert. There are also buttons to take action on the alert, including the ability to acknowledge it, close it, delete it, or add a note to it. Considerations for Initial RAS Alerts Your system may display the following Problem Summary RAS alert: Problem Summary: Disk serial number MS6982QP1K3W in SW RAID device(s) ['esos_data'] is rebuilding
This condition is expected and not a cause for concern. You may observe this message on systems that have been freshly re-imaged or are new from the factory. During manufacturing, systems are not left powered on long enough to allow RAID resynchronization to complete. As a result, when the system boots for the first time at a customer site, the RAID1 array(s) for the boot drives may still be rebuilding or resynchronizing. |
| 8 | LOGS – provides a list of log information for system events. It displays collect logs (default) or click the Only Collect Logs toggle to display all the logs for the system, or you can click in the Search Log Filenames and type to search for a specific log (results "auto-display" relevant entries as you begin to type). |
| 9 |
"admin" – This is the name of the user currently logged into the F2200. Note: There is currently only one user available in the F-Series UI, the |
| 10 | User account – change password and log out options. Currently, there is only one user account for the system, |
| 11 | System options – items like "About" the system, contact Quantum Support, enable/disable ToolTips (enabled by default) and an option to change the UI color Theme (dark or light). |
| Item | Description |
|---|---|
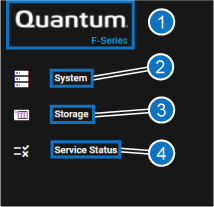
| 1 | Quantum logo – click here to open the F-Series UI Cluster page (default view). |
| 2 | System – displays overall Health History, a Current Health gauge, and health of individual hardware Components (for boot drives, fans, power supplies, storage drives, and software RAID devices) |
| 3 | Storage – |
| 4 | Service Status – (status of services running on the system), SCSI Target Sessions (statistics for active SCSI connections), and SMART metrics (SMART HEALTH, and SMART METRICS, for both controllers, or a specific controller) |
| Item | Description |
|---|---|
| 1 |
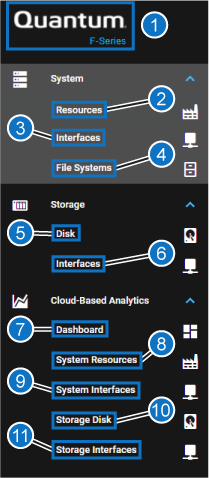
Quantum F2200 logo – click here to open the F-Series UI Cluster page (default view). |
| System | |
| 2 | Resources – default view; displays graphs of CPU and Memory Utilization |
| 3 | Interfaces – displays graphs for network interface performance |
| 4 | File Systems – displays status of system storage from the perspective of the configured file systems |
| Storage | |
| 5 | Disk – displays graphs of disk performance |
| 6 | Interfaces – displays graphs of storage interface throughput performance |
| Cloud-Based Analytics (functional when CBA [Cloud-based Analytics] is configured on the system) | |
| 7 | Dashboard – opens in a new Window and requires an active CBA login; displays the main CBA dashboard |
| 8 | System Resources – opens in a new Window and requires an active CBA login; displays the same information as the System > Resources page in the F-Series UI |
| 9 | System Interfaces – opens in a new Window and requires an active CBA login; displays the same information as the System > Interfaces page in the F-Series UI |
| 10 | Storage Disk – opens in a new Window and requires an active CBA login; displays the same information as the Storage >Disk page in the F-Series UI |
| 11 | Storage Interfaces – opens in a new Window and requires an active CBA login; displays the same information as the Storage > Interfaces page in the F-Series UI |
| Item | Description |
|---|---|
| 1 |
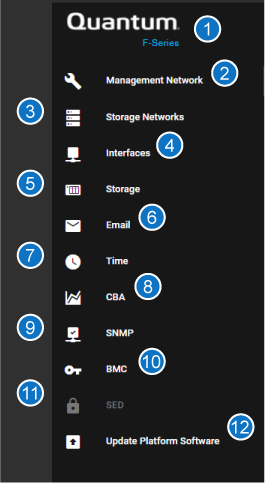
Quantum F2200 logo – click here to open the F-Series UI Cluster page (default view). |
| 2 | Management Network – configure the management network settings |
| 3 | Storage Network – configure the storage network settings for system interfaces, for storage networks that will not be configured as converged storage using iSER iSCSI connections. |
| 4 | Interfaces – use to view configured interfaces on the system and interface performance/throughput graphs. |
| 5 |
Storage – shows the overall storage settings for the F2200 RAID chassis. |
| 6 | Email – configure the email used to receive RAS alert messages for the system. |
| 7 | Time – configure the date and time settings to be used for the F2200. |
| 8 | CBA – configure settings for sending F2200 data to the CBA web interface. |
| 9 | SNMP – configure SNMP network settings for the F2200. |
| 10 | BMC – Configure system IPMI connection to remotely power the system on and off. |
| 11 | SED – SED drives are currently not supported, so this menu option is not functional. |
| 12 | Update Platform Software – use to update system software using an internet-connected repository, or a locally-uploaded update file. |
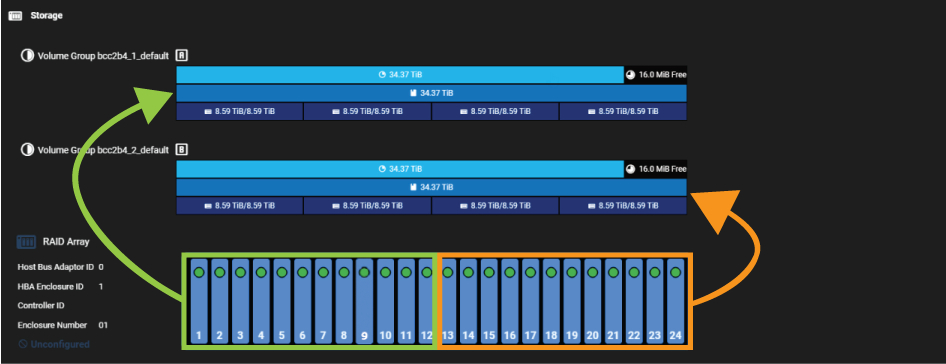
On this page, you can see the current storage configuration on the system, and make necessary changes.
Note: When you use write-cache (write-back cache) on logical volumes in your H-Series product, initiator applications that care about data consistency should always flush the cache when necessary (via SYNCHRONIZE CACHE). The target-side write-back cache software auto-commits cache metadata at a regular time interval and when a blocks-written quantity threshold has been reached, however, in the event of a storage array power loss or firmware crash, the application must flush the cache for any critical writes (for example, data is not guaranteed to be on stable media until an fsync() occurs). If this behavior is not acceptable, you can remove write-cache for the logical volume(s) by running the remove_vol_cache QBSP shell command.
If you create a striped logical volume (a logical volume that uses more than one physical volume [PV]), the stripe size across each PV is equal; if the unit of measure, for a value of a given size, is percentage (%), then the process uses the smallest amount of free/available on one PV, and multiplies this by the number of selected PV’s.
The F2200 comes pre-configured from the factory as a RAID6 10+2 with 2 volume groups and 2 LUNs (1 LUN per each volume group):
- Uses multiple NVMe namespaces per drive
- RAID sets distributed between controllers for multi-threading storage access
- 1 volume per controller distributes workload
| Item | Description |
|---|---|
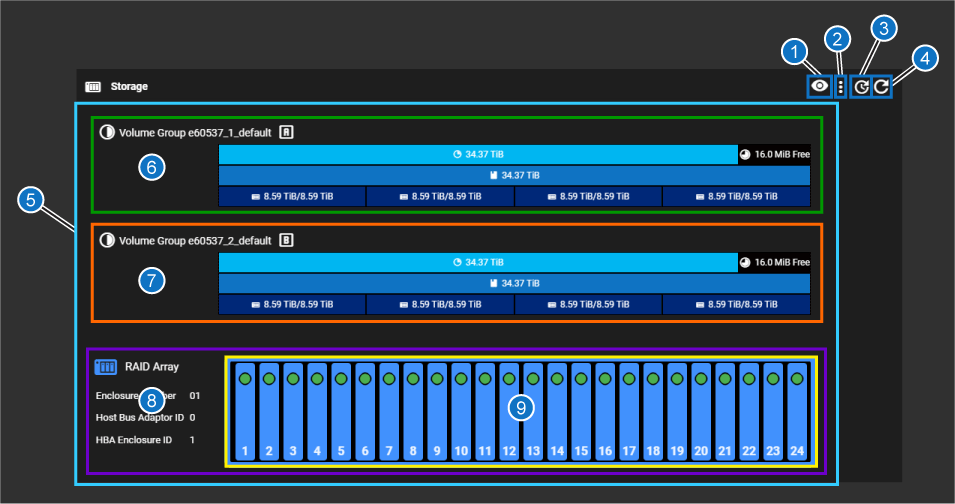
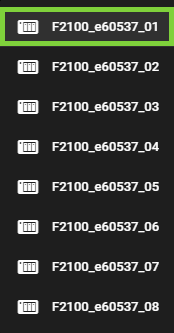
| 1 | Select Physical Volume button – when you click this button, all the physical volumes (8 are configured on the system by default) are displayed. Click one of the physical volumes to view which physical disks make up that volume in the RAID array graphic at the bottom of the above image (item 9 above). |
| 2 | Manage Physical Volumes button – use this to add or remove physical volumes, to detach all degraded drives, or attach all drives ready to be added to the RAID. |
| 3 | Time interval button – use this to change the refresh interval for the CONFIGURATION > Storage page |
| 4 | "Refresh now" button – refreshes the array display immediately when clicked. |
| 5 |
All elements related to the storage array. If there were additional JBODs, they would be listed after the RAID array shown above (light blue box above). Includes items 6-9 below: |
| 6 | Volume Group managed by Controller A (green box above). See Volume Group visual overview. |
| 7 | Volume Group managed by Controller B (orange box above). See Volume Group visual overview. |
| 8 | Information about the RAID array (purple box above). |
| 9 |
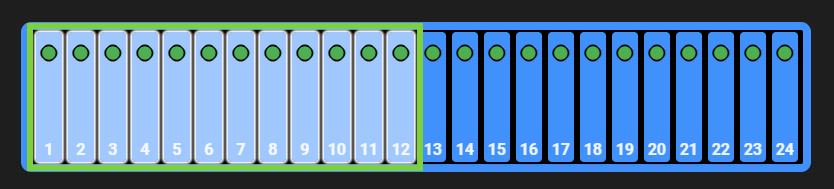
Chassis drives diagram – this is a visual representation of the physical chassis with drives numbered from 1 to 12 (for 12 drive chassis) or 24 (for 24-drive chassis; yellow box above). Drives in blue with a green indicator are 100% healthy, configured drives. |
Caution: Quantum recommends leaving the storage configuration unchanged after initial configuration. ONLY change this if absolutely necessary (such as if settings change within your network ecosystem). The system was optimized during initial configuration for your network and storage environment. You could adversely affect efficiency of the system if these settings are changed incorrectly.
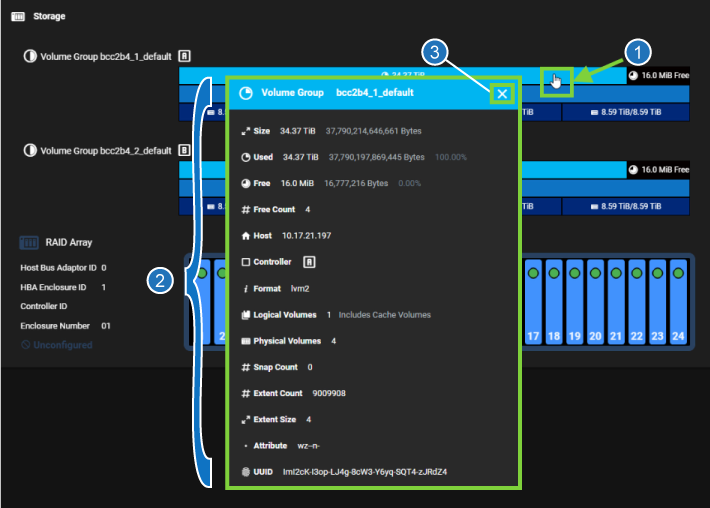
Each "Volume Group" is presented in the F-Series UI graphically as follows:
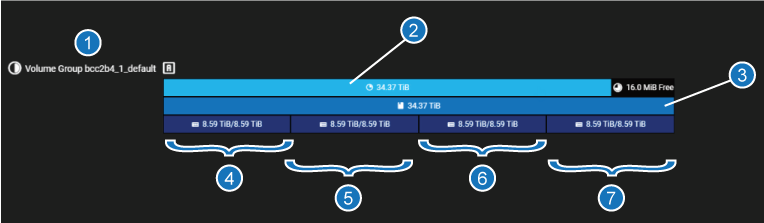
| Item | Description |
|---|---|
| 1 | Volume Group name and letter (first group, as shown, is the "A" volume group; the controller that manages this group has the same name as the volume group, Controller "A") |
| 2 | Volume Group (provides total storage in use, and free, if applicable) |
| 3 | Logical Volume for this volume group (in this example, there is one; could be many) |
| 4 | Physical Volume/Raid Set (in this example: the first of four) |
| 5 | Physical Volume/Raid Set (in this example: the second of four) |
| 6 | Physical Volume/Raid Set (in this example: the third of four) |
| 7 | Physical Volume/Raid Set (in this example: the fourth of four) |
-
Click the Select Physical Volume button:

-
Choose a physical volume to highlight in the chassis drives diagram on the page.
-
Deselect the physical drives by clicking the Deselect button:

Example:
The selected physical drives that make up the physical volume are highlighted in a light blue shade, as indicated in the green box below:
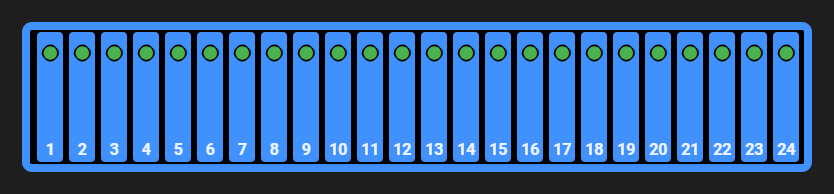
The drives will return to their normal view state:
Since this example is a 24-drive system, the storage is organized into:
- Volume Groups ("RAID"). There are two volume groups in the system comprised of 2 x 12-drive, (1 Volume Group for each set of 12 NVME drives in the system, each of which is managed by its own controller, either Controller A, or Controller B). The following how the 12 physical storage drives per Controller are associated with the Volume Groups shown above them in the F-Series UI:
- Logical Volumes (LUNs) - from the factory, each RAID is configured as a single logical volume
- Physical Volumes (RAID sets)
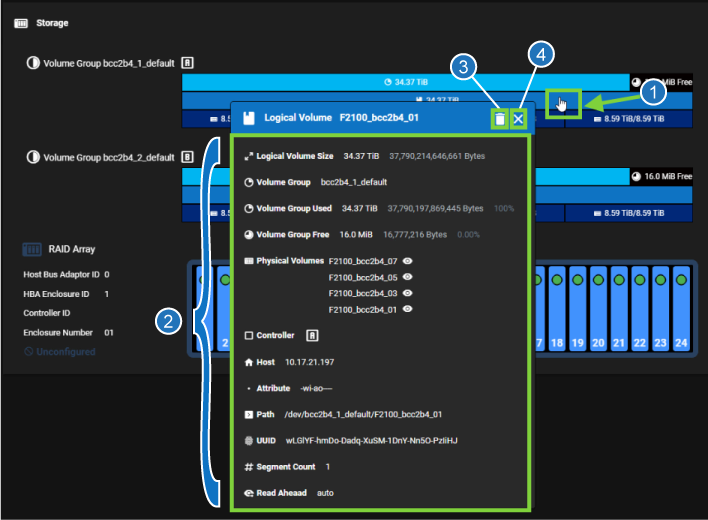
Click on one of the different volume types to see to view information about that volume type, and perform actions on that volume.
| Item | Description |
|---|---|
| 1 | Click on this area to open the "Logical Volume" dialog. |
| 2 | Information displayed for the "Logical Volume". |
| 3 | Close button for the "Logical Volume" dialog. |
Caution: Quantum recommends leaving the storage configuration unchanged after initial configuration. ONLY change this if absolutely necessary (such as if settings change within your network ecosystem). The system was optimized during initial configuration for your network and storage environment. You could adversely affect efficiency of the system if these settings are changed incorrectly.
| Item | Description |
|---|---|
| 1 | Click on this area to open the "Logical Volume" dialog. |
| 2 | Information displayed for the "Logical Volume". |
| 3 |
Delete button used to delete the "Logical Volume". Caution: Once you have configured your system storage, changes to the storage configuration WILL DESTROY DATA in an active storage environment. Make sure you intend to change storage configuration and have backups of ANY CRITICAL DATA prior to making changes, if you have data that you need to keep on the system. |
| 4 | Close button for the "Logical Volume" dialog. |
Caution: Quantum recommends leaving the storage configuration unchanged after initial configuration. ONLY change this if absolutely necessary (such as if settings change within your network ecosystem). The system was optimized during initial configuration for your network and storage environment. You could adversely affect efficiency of the system if these settings are changed incorrectly.
| Item | Description |
|---|---|
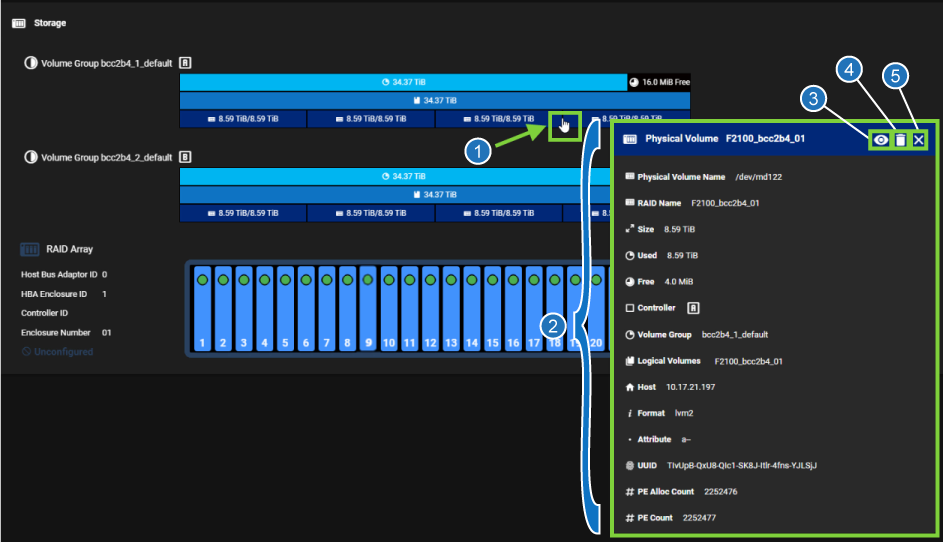
| 1 | Click on this area to open the Physical Volume dialog. |
| 2 | Information displayed for the physical volume. |
| 3 | Eye button to highlight the portion of the system lower down on the page to display which drives are part of the physical volume. |
| 4 |
The Delete button is used to delete the physical volume. Note: For storage running QBSP Caution: Once you have configured your system storage, changes to the storage configuration WILL DESTROY DATA in an active storage environment. Make sure you intend to change storage configuration and have backups of ANY CRITICAL DATA prior to making changes, if you have data that you need to keep on the system. |
| 5 | Close button for the Physical Volume dialog. |
For systems running QBSP
Workaround
This issue was fixed in 2.0.2, so you will no longer see this issue on a system running 2.0.2 or later software.
There is currently no workaround for this issue for systems running
- When Tool Tips are enabled (default) in the F-Series UI, hover-over or click the Tool Tip icon:
 to display additional information about the element in question. Tool Tips provide not only important additional information, but for some text entry fields, also include rules/syntax for filling in the field and what those entries are used for.
 - For checkboxes or on/off toggles, click items to enable/disable them
- To change values or configure a set of fields, enter values in the required fields
- Click Apply to change options
- Move your cursor over items in graphs to view additional detail about the area
- On the Health page, move your mouse over a row to highlight that row
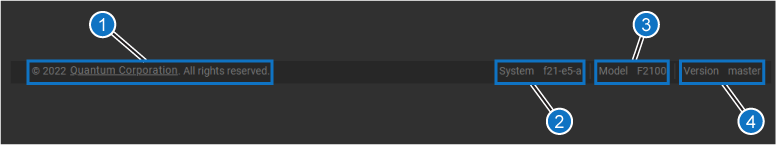
| Item | Description |
|---|---|
| 1 | Copyright information |
| 2 | System hostname |
| 3 | F-Series model |
| 4 | Version build type |